❌

Reading view

Why Is Jeff Clark so Excited About Trading in 2026?

Dear Reader,

Our final podcast for 2025 is in – and it was such a fun one to film. Jeff breaks down what happened in Wednesday’s Fed meeting, what he’s looking forward to in 2026, how trading in volatile markets isn’t about being bearish, and more.

Let us know your thoughts right here at feedback@jeffclarktrader.com – do you want to see more podcasts in 2026? What topics should we cover?

Thanks, as always for joining us. Enjoy the holidays!

Regards,

Rachel Bodden signature

Rachel Bodden
Senior Managing Editor, Jeff Clark Trader

Transcript

Rachel Bodden: Hello. Welcome back to another episode of Jeff Clark’s Master Trader Podcast.

Jeff Clark: You’re calling it Master Trading. All right, I’ll go with it. Excellent. Good to see you too, Rachel.

Rachel: We have a brand-new YouTube channel we’re working on getting set up, which is very exciting. This is our sixth episode. That means we’ve been doing this for half a year.

It feels like a lot has happened this year, and I can’t even explain it, but we’re super thrilled to be doing this for you guys. We’ve had a lot of really positive subscriber feedback, so please keep letting us know your thoughts at feedback@jeffclarktrader.com because we love to hear from you. Send in your questions, thoughts, and concerns, or what you’d like us to talk about, because we love to address that for you.

So I guess we’ll start with, to me, the elephant in the room: yesterday’s Fed meeting. Tell us a little bit about what happened and what that might mean for next year.

Jeff: Well, like every other Fed meeting, there wasn’t anything shocking that came out of it. The Fed dropped short-term rates by 0.25%, and everybody had already anticipated it. Everyone figured there’d be two dissenters, including the one gentleman who wants 50 basis points.

They cut rates by a quarter, but what was surprising was a comment he made three-quarters of the way through. He was very careful in stating this isn’t quantitative easing, but they’re going to be buying Treasury bills – roughly about $40 billion every month for the next several months.

Rachel: So where are they getting that money if it’s not quantitative easing?

Jeff: First, before we get to that, the purpose – as Chairman Powell stated – is to relieve some of the liquidity pressures on the banks. That’s important to understand because the Fed doesn’t work for us; the Fed works for the banks. Whatever they do ultimately benefits banks. Collateral may help us, but the direct benefit is always to the banks.

So whenever the Fed is injecting liquidity, my assumption is they see something happening, or they project something might occur, that causes stress in the system, so they need to get ahead of it. Now, where do they get the money? As Ben Bernanke said, there’s a button on his desk he could press at any time, and it generates liquidity. They print the money and then provide it to the market.

Ultimately, increasing the money supply is inflationary. That raises demand and pushes prices higher because more money is chasing fewer goods. In the short term, that’s asset-positive. The market saw this as bullish because the money takes pressure off the Treasury, which needs to issue longer-term bonds.

Rather than issuing 10-year notes at 4.15% or 30-year notes at 4.7%, they can issue Treasury bills that the Fed will buy at 3.5%. That takes pressure off the bond market, and if you’ve watched bonds the past six weeks, they’ve sold off and yields have gone up. That creates financial pressure in the system.

So the Fed did everything right yesterday: they lowered interest rates as expected, and they showed they understand there is stress in the bond market. No surprise that stocks rallied. My concern, the same one I’ve had for months, is that valuations, sentiment, and expectations are all high. There’s nothing cheap.

Having said that, there is a large swath of stocks trading at single-digit P/E multiples. They’re out of favor and unloved, so there are bargain opportunities. But if you’re looking to chase tech stocks or high-flyers, let Oracle’s earnings report be a lesson. Oracle was $350 two months ago and today it’s going to open around $190. It’s a tech giant, it’s AI, it’s everything people rave about, but it had no business being $350 – and even at $190, trading at around 32 times earnings, it still seems pricey to me.

Once you push that sector aside, there are bargain opportunities you can take advantage of right now.

Rachel: That was an excellent answer. I think those explanations are what our readers really need, and you make it so easy to follow. A lot of financial analysts talk way above people’s heads, and that’s the point – so you don’t actually know what’s going on under the hood.

Jeff: You’re not going to get many five-syllable words out of me. I’m not that smart.

Rachel: Oh, please. But we’ve talked about this in Market Minute, our free e-letter. Jeff talks about what’s going to happen in the market in very short terms, and it’s easy to understand, just like he always is.

We’ve talked a lot about the bond market and the yield curve. Is there anything you’re seeing there that might have some parallels to other scary points?

Jeff: Yeah, you know the answer to that. I’ve been harping on this all year, sometimes to my own demise because I haven’t participated fully in the market. I keep seeing this giant rain cloud in the distance, so I’m always carrying an umbrella. Meanwhile, everyone else is dancing on the beach, and I’m bunkered down.

The yield curve is the issue. It was inverted for almost two years – the longest time it’s ever been inverted. That means short-term rates were higher than long-term rates, which is abnormal. Usually, the longer you go out in time, the higher the interest rate.

We were inverted for almost two years, and only back in September did we go back into positive territory. Now it’s starting to accelerate. If you look at a yield curve chart, you can see it clearly.

When you compare this to previous times – 2020, 2007, 2001, 1990 – those were all periods right before difficult economic times. Each was followed by a recession and a poor period for stocks. Not all stocks, which is why I said earlier there are cheap names that will eventually get some love once enthusiasm fades from tech and AI.

I think the impact is coming in 2026. I thought it would happen in 2025, but from a cycle perspective – especially the presidential cycle – 2026 makes sense. We’ve had three straight years of double-digit S&P gains, and the fourth year is usually difficult.

The biggest cloud is the yield curve, but I think that presents opportunity. Folks who have been conservative and raising cash will have chances to put that money to work.

Rachel: For you, the type of market we may see in 2026 is one you love to trade. There are so many opportunities when stocks come back up. Nothing goes down in a straight line, and nothing goes up in a straight line. That’s why you had some of your best trading years in 2008, 2020, and 2022.

Jeff: Exactly. People look at my track record in those years and think, “Well, he’s bearish, so of course he does well in a bear market.” But that’s not how you do well in those markets. Almost the best trades I made in 2008 were from the long side.

Bear markets create more volatility. My trading style – mean reversion – takes advantage of oversold stocks bouncing back up and overbought stocks coming back down. That works great in volatile markets. But when you have a one-way market like we’ve had since April, there isn’t enough volatility to make that strategy attractive.

I expect next year to be very volatile, similar to 2000, 2008, or 2022. All of those were good mean-reversion trading years. I also look for stocks that are cheap, unloved, and coming off bottoms. That’s like fishing in a small pool full of giant trout – it’s easy, but you have to be patient.

This year didn’t reward patience. Momentum dominated. Shorting expensive stocks would have gotten you run over. But as things start rolling over next year, we’ll probably be more aggressive on the short side.

And here’s my goal: you tell me a stock you want to buy, and I’ll find a way in the options market to lower your risk and increase your reward. If you want to leverage two or three times, that’s fine – but when you start doing 5, 10, 20, 50 times leverage, you’re going to blow up your account.

A lot of beginners get lucky with high-leverage trades and think they’ve mastered it – until the market humbles them. You must avoid the gambler’s mentality. Options should reduce risk while increasing reward.

Rachel: For someone just starting out with options, what would be your first piece of advice?

Jeff: Start small. Some people say paper trade, but it doesn’t work because you’re not emotionally involved. When you have money on the line, you’re emotionally invested – just like betting on the Super Bowl.

When you’re paper trading, it’s easy to say, “I’m down 50%, I’ll take the loss,” or, “I’m up 100%, I’ll take the gain,” without thinking. But when you’re in the trenches with real money, emotions drive your decisions. You have to learn how your emotions affect your ability to trade.

Start with one or two contracts to get a feel for it. If you’re high-strung and a five-cent move on a $2 contract sends you over the edge, you need a strategy that accounts for your temperament. If you can master emotional control, options trading becomes more like solving a puzzle – and it becomes more fun and more profitable.

Rachel: You talked about the options market as a puzzle – the kind you’ve been working on for years and never get bored with because there’s always something new to figure out.

Jeff: The market itself is a puzzle. It evolves, so a strategy that worked three months ago might not work now. You have to adapt. Every day I get up and think, “How am I going to solve this puzzle today?”

I’ve been doing this for over four decades, and I can’t imagine not doing it. On Saturdays and Sundays when the market is closed, I still find myself doing chart reviews. It’s a game that never ends, and once you’ve played it long enough – with successes and failures – it becomes a passion. I’ll be doing this forever.

Rachel: I love how you talk about the markets. But now that you live in Miami, on Saturdays and Sundays, go to the beach – maybe get that scuba license we talked about.

Jeff: There’s always that opportunity. The great thing is you can take a laptop anywhere and trade from anywhere – on the beach or by the pool on the 50th floor.

Rachel: As much as we harp on tech stocks, technology really has given us so much freedom. Just to close out here: we’ve been talking about sectors that might do well next year. Do you want to give us a couple besides energy?

Jeff: There are lots of stocks trading cheap right now. The energy sector is cheap. Months ago I talked about healthcare being cheap, and I think there’s still opportunity there.

Food stocks surprise me – Albertsons (ACI), for example. It trades at eight times earnings, and it’s a grocery chain expanding and increasing margins, but nobody cares because it’s “just” a grocery chain. Restaurant stocks are showing up too.

Cable companies are another odd one. Charter Communications (CHTR), Comcast (CMCSA), and another one I can’t recall – all three have beautiful bottoming patterns and historically low multiples. It’s a no-growth business, but the companies are adjusting and evolving. The stock market hasn’t appreciated that yet, which is why they’re down 50–70% from their highs.

I think 2026 will be the year of cable companies – sounds horrible, but next year we’ll check back on them, and I bet many will be up 50–70%. Payment processors like PayPal, Paychex, and Fiserv have been battered too. There’s opportunity everywhere if you look for stocks trading below their normal valuation ranges and figure out whether the situation is recoverable.

Rachel: That sounds like a high note for us to wrap up on. Next time we see you, we’ll be in the new year, and I think it will be a really exciting trading environment. Jeff, thank you for doing these podcasts for the past six months – I hope we’re doing this for a long time.

Again, let us know if you enjoy our content or want to hear other topics or questions. We’d love to hear from you at feedback@jeffclarktrader.com.

Jeff: Thank you so much. Thank you, Rachel.


  •  

Here’s Where the Money Is Flowing

Dear Reader,

Rachel Bodden, Jeff Clark’s senior managing editor here…

Our next podcast is in…

Today, Jeff tells us his thoughts on the markets, where he thinks we’re headed, and talks about where the money is set to flow out of…and in to over the next few months.

Check it out below, or see the transcript on the website or the Jeff Clark Mobile App (you can find the Android version here and the Apple version here).

And remember, send us your questions, feedback, or topics you want us to cover in the future at feedback@jeffclarktrader.com.

Regards,

Rachel Bodden signature

Transcript

Rachel Bodden: Hello, and welcome back to another podcast with master trader Jeff Clark. And I’m Rachel Bodden, your host. Now there’s a lot going on in all facets of the world, markets, politics, you name it. So Jeff, we’ve been talking about how markets are basically priced for perfection in a lot of ways. And we’ve seen earnings reports come in like Palantir yesterday. And even though they beat earnings, they opened the day down. So you’ve been talking about how that money is going to move from overpriced markets basically to more consumer staples. Can you talk about what’s happening today?

Jeff Clark: Yeah, well, that’s my basic theory. I think a lot of the tech stocks, a lot of the stocks that have been moving this market higher over the past couple of months have gotten out over their skis, right? They’re a little ahead of themselves. Palantir is a great example because it was a phenomenal report. It was the best report the company’s ever had. They beat on every single metric and it wasn’t a small beat. It was a large beat on every single thing. And yet the stock is lower.

And the reason the stock is lower is because it probably didn’t have any rational reason for being up at above 200 bucks a share to begin with. Simply because at 200 bucks a share, I think it’s trading at 90 times revenue, which is just an absurd amount, going out to 20, 30 revenue estimates, by the way, 90 times that figure. That’s a very, very expensive valuation. Granted, the stock has been fabulous. The company is doing wonderful financially. The company is growing like crazy.

But at some point, you have to ask yourself how much are you willing to pay for this? And apparently, that stops at somewhere around 210 bucks a share for Palantir, which was its high yesterday. And now it’s had a nice little reversal. And I’m not saying it’s headed to the dirt floor or to the basement or anything like that. But a little sell on the news makes a little bit of sense here. The stock has just gotten too far ahead of itself. And what ought to happen is you’ll see that in other stocks as they report earnings over the next week or two.

What ought to happen is that money comes out and it has to find a home somewhere. And usually what happens in an overbought, oversold situation where you have so many stocks that are overbought and so many stocks that are oversold is some of that money comes out of the overbought stocks and it goes into the oversold stocks. So you ought to see, in theory, some of that money that comes out of Palantir and out of the high tech stocks go into some of the beaten down sectors. And there’s two sectors that I’ve had my eyes on for the past several weeks that I think are setting up for a decent year-end rally. And I think that’s energy, which is the oil and gas and natural gas companies. And it’s consumer staples, which is mostly food stocks. No matter what happens in the world and in the economy, we need energy and we need food. And those are the two things that we all have in our budget. We have to spend money on no matter what happens in the world. So those are the two sectors that I think have the most to gain if this market reverts to the mean.

If you will now, granted, I’ve been saying that for a little while now and nothing much has happened. And even today, you look at the stock market’s falling and money’s coming out of these high flying stocks and it’s really not moving into those sectors just yet. It’s sort of taking a move on the sidelines. Everything seems to be down a little bit today. But in theory, this is where I’m going and this is where I think if you’re looking to make above average returns over the next couple of months, I don’t see that happening in sectors that are already so far overbought, that rubber band has to snap back a little bit.

But I do see it happening in some of the value names, which are mostly in the energy sectors and in the consumer staples, which nobody likes by the way. as I say this, I know people are going to roll their eyes and they’re going to, but I played this game long enough. I, I, you don’t go wrong buying low and selling high, right? That is how you make money in the stock market, buy low and sell high. What has happened over the past several months is people have bought high and sold higher, or they bought high and they’ve never sold. So as that selling starts to happen, think it winds up going into some of that money goes into the over-sold sectors, the beaten down sectors.

Rachel: So, we’re talking about some sectors that are just too high flying and I’m assuming you’re talking a bit about your tech and stocks. So do you see any parallels between how the stocks are valued right now? And for example, companies in the dot com era.

Jeff: Well, yeah, of course there’s parallels with that. I told a story before. In fact, I think I wrote a Market Minute about this. You know, when you go back to 1999 or early 2000, and you look at Amazon. And Jeff Bezos did a speech recently where he talked about Amazon peaking at $123 a share. And then two years later, it was trading at $8 a share, even though the company itself was in far better condition when it was at $8 a share than it was at $123.

All metrics, the company was doing better than what it was when it was overpriced at 123. And the lesson to that is you don’t have to chase into these names as they’re going through lofty, lofty valuations. There’s no doubt the internet changed the world. The internet changed the markets. The internet changed how we behave. The AI will probably do the same thing. There’s no doubt a lot of these AI companies, if they survive over the next several years, some of them will change the world and they will be the Amazons of the early 2000s. So there’s no doubt some of them will exist in the future and they’ll exist at much higher prices. But at the present moment, if you go back to 2000 and Amazon at 128, a lot of these stocks look a lot like Amazon at 128. And prior to Amazon getting to 128, it traded at 80. So here’s a good example. There were two investors back then. There were those,

Everybody realized that the dot com was in a bubble. Anytime you start talking about valuations that are a hundred times revenue, where you start changing the metric, where you’re valuing companies on eyeballs and landing pages and all this sort of things, and we’re not talking about earnings anymore, you know there’s a bubble being created. So everybody with Amazon at 80, everybody understood it was overpriced, it was overvalued, it reflected, it was trying to discount things far into the future, and really you had a bubble brewing.

You had two types of investors. One was types like me who couldn’t understand the valuation and stayed away from it. And then there are other types who recognized that we were in a bubble, but had to dance while the party was going on, right? Dance while the music is playing so they would buy it anyway with the thought that they could get out before that bubble pops. The problem is trying to figure out where that bubble pops. know, Amazon went from $80 to $128. It was overvalued at $80. It was certainly overvalued at 128, but if you didn’t mind only at $80, as it was overvalued, you certainly didn’t mind owning it at $128.

Tell me where is the maximum level before the bubble pops? Nobody knows the answer to that. So when the bubble finally pops, nobody rings a bell, nobody says, hey, this is it. Oh, what happens is the stock slowly loses a little bit of gas. So Amazon goes from 128 down to 110 or 100. People go, gosh, it’s on sale, it’s 15% off. I’ll go ahead and buy more. And then it drops a little more, drops to 90. Oh, I’ll buy even more here at 90.

Then by the time people realize that that bubble has actually popped, Amazon has gone from 128 maybe to 50 or 60. Now the thought process is, as a normal human, I can’t sell it. Now it’s down 50%. It’s already down 50%. Most of the pain’s already been inflicted. It’s not going to get much worse than this. So either I’m going to hold on or maybe I’ll buy even more. And then ultimately it winds up down at 10 bucks a share or eight bucks a share ultimately for Amazon, where the pain is just too much for folks and they finally bail on it and that’s the time where you see the end of the deflation of the bubble and when the company start to go again. So human behavior doesn’t change. Human behavior is, like the party, I like the music, I’m going to dance while it’s playing and I’m smart enough to get out before the bubble pops. I know I’m not smart enough to do that. I recognize that fault in me. So I’m not going to play that game. I’m simply going to wait until the bubble actually pops and all the dust settles, then I’ll start.

Or IREN, which has gone from 10 bucks a share to 80, or Sandisk, which is trading, I don’t know, 37 times earnings, which is three times its normal multiple. Some of these stocks, the air has to come out of them. They’re not going to sustain those multiples for years. It just, the markets don’t work that way. So right now you have a situation where the enthusiasm is there because we all recognize the potential of the AI boom, but I think people are forgetting that valuation is still an important part of investing. And when you chase stocks that are overbought and overpriced, usually that’s a bad strategy in the longer term. In the short term, who knows? People can make money, but in the short term, you have to decide for yourself at what price, if you’re willing to buy a stock that’s overbought and overextended, counting on it getting more overbought and overextended, at what price are you willing to sell it? Because you have to sell it at some point in order to lock in those profits.

It’s interesting when people talk about losing money in the stock market, the consolation phrase is often, well, you don’t lose until you sell. So the idea is you bought a stock and it’s gone down. You really haven’t lost anything until you sell it, so maybe it’ll come back and make you whole again. You don’t hear that when people buy stocks. When they buy stocks and they go up, they, hey, look how much money I’m making. Nobody really ever sells it and says, hey, look how much I made. No, they hold onto it. And then that money disappears. You don’t really profit until you sell otherwise, is sort of the point I’m trying to make. Like I said, buying stocks that are overbought and overextended or overvalued is usually a very, very poor strategy in the longer term.

Rachel: I mean, I’m not smart enough to know where that bubble pops either. So I always just take that out of my own hands and I put, I just follow my little stops and I just let the computer do it for me.

Jeff: Rachel, that’s a very smart thing to do. If you’re going to play that game, if you’re going to keep dancing while the music is playing, as they say, then yeah, make sure you follow it up with a stop. And in many cases, if you had a stop on something like Meta, after it reported earnings last week, I think it’s down more than 20% from its high. So you’d probably wind up getting stopped out of that. So as long as you honor those stops, lot of folks have a difficulty doing that. They’ll set the stops and then the stock comes on down, they go, wait, no, I can’t sell it now, I’ll pull the stop out and that’s usually where the disaster happens. So you never go broke taking a profit and protecting yourself on the way down is of paramount importance. Because as long as you have money, you’re still in the game. If you run out of money, you’re out of the game and that’s where people make their errors.

Rachel: The first rule is don’t lose money. So I always sell half when I hit 100%, just like you. With these kind of high flying stocks, do you on your own time like to play with options on them? Or do you just stay away?

Jeff: I do not trade options on the high-flying stocks because the options are relatively expensive. I will do sometimes crazy things. I’ll sell credit call spreads if I think the stock’s gotten a little ahead of itself. That’s basically where you’re shorting the call option, but then buying another call option, a couple of strike prices higher just to protect yourself in case something really insane happens. Having gone through the dot-com craze, I had lost enough money shorting stocks or trying to short stocks as that bubble was inflating, that I now realize that trends can last a lot longer than you think they can.

And that they can certainly last longer than you can stay liquid, as the old saying goes. So I try to do everything to manage my risk a little bit. So by selling a credit call spread on some of these stocks is they’re making all-time highs and they’re extending beyond things. It generates income, much like I like to do by selling uncovered puts on oversold stocks. And it protects me in case I’m wrong on the trade and the bubble keeps inflating.

Rachel: So we actually have a question about option spreads from Alexander C. And he wants to know why you seldom suggest option spreads.

Jeff: Well, here’s why. And Alex has a very valid point. I think option spreads make a lot of sense, especially now that you have weekly options, because any time that you have a time frame that expires in a short distance, just a few days, spreads can be a very valid strategy. The problem with spreads the way they used to be is you only had monthly options. So if I was to do a spread today, I would use a November or maybe a December spread. The problem with it is the option decay on the option that you bought and the option decay on the option that you sold is roughly the same. And so you don’t really profit that much until the final few days of it where the intrinsic value of that spread becomes clear. So if you were to put a spread on today, betting that, a credit call spread for example, betting that XYZ stock is about to fall and it actually falls, but you have a three-week expiration, three weeks to expiration.

You’re going to lose as much on the long, sorry, lose as much on the short position as you would make on the long position. So you can’t really do anything. And so it’s quite possible the stock actually makes the move that you had anticipated and then reverses and comes back up by the time your option expires. So credit call spreads only work or any sort of spread, think only works on a very, very short-term timeframe. So if I thought something was going to happen or a move was going to happen over the next three or four days, I could use weekly options now to do that. Most of the time with my subscriber base, there’s a couple of things. If I recommend a spread option, the few times that I’ve done it, I get a lot of complaints that this isn’t the type of trades I like to make. And I don’t want to try to force my particular strategy on folks if they’re not comfortable doing it or they don’t understand it. There’s probably going to come a time and I think it usually happens in bear markets where using spreads makes a lot more sense than simply buying outright options. And we’ll have, we’ll start to introduce those particular strategies. But the reason I haven’t done it recently is because of that premium decay function that we just talked about. If you have a monthly option, the gain is usually going to be better on a single option strategy than on a spread.

Rachel: Well, let’s pivot back to some of the stocks we’re talking about before, like money flying out of the high flying AI stocks and going into consumer staples. Do you think that it might be a perfect storm for those food stocks considering we’re heading into like the longest government shutdown ever and people have just lost their SNAP benefits? Do you think that even is more wind behind those consumer staple stocks right now?

Jeff: Well, the food stocks are ridiculously cheap in my opinion. You look at something like, I think I recommended Flour Foods, I call options on Flowers Foods in one of my services. I like Nomad. We looked today at Vital Foods, VITL is the symbol there, and they basically distribute eggs. That stocks up 15%, but the chart on it, if you look at the chart, it’s just this descending of death that’s happened over the past two months in that particular stock gone from 52 down to 32. They announced earnings today that were better than expected. They beat on everything. And you have this incredible surge because nobody was anticipating that. That’s the exact opposite of what you see in Palantir, where they announced earnings that were better than expected and all that sort of thing, but the stock had run up so much going into it. So you really have a perfect illustration of what I think can happen over the next couple of months, where the high techs sell off on their earnings news and the beaten down food stocks actually do well.

Now in terms of what happens with the SNAP benefits being lost and all this sort of stuff? Trying to think of who it was last week. was Chipotle. Talked about how they were losing customers in the low income brackets. Those customers still have to eat. We still have to find food somewhere. So I don’t think people are going to stop eating because the funds aren’t there. First of all, SNAP benefits are going to come back. People are going to get their checks. People are going to spend. There’s going to be some way of working out because the government is not going to stay shut down permanently. So I think that only has a temporary situation and maybe it has exacerbated the oversold conditions in that sector, but it hasn’t eliminated the potential for profits in that sector. So, you know, the government shutdown has done a lot of things and there’s a lot of reasons to be upset about it, but there’s also, by the way,

I’ll just rant politically for a second here. There’s also a lot of reasons to be upset about the fact that we have 48 million people getting food stamps. What is that? We have 300 and some odd million people in the country, so we’ve got roughly 15% of the country on food stamps. That is absurd to me. The idea of the SNAP benefits was to be a temporary leg up. I help pull you up, satisfy things temporarily so you don’t starve.

And it’s become a sustained program for so many people. And I’m not sure who to be upset with about that. And then the other side of that is when you talk about government employees who aren’t getting their checks, they will get their checks. Many of them have basically received a paid vacation for the past while, but they will get their checks. They talked about how all these government employees don’t have money now to spend on food or basic necessities. And I start thinking, gosh.

I thought government jobs were good paying jobs with good benefits. And now you’re telling me these people who have those good paying jobs with good benefits can’t sustain more than a month without getting a check. That just seems a little strange to me. So the larger concern is why is everybody basically living paycheck to paycheck? It doesn’t make a lot of sense in my head. Like I said, if you’re to be outraged, be outraged about that sort of thing, that there’s so many people on food stamps and there’s so many people that are living paycheck to paycheck and you have to wonder why is that?

Is that a personal behavior problem or is it maybe things have gotten too expensive? I don’t know. I don’t know how to argue that, the, I don’t know. Something we’ll talk about in the future, I guess, something to certainly pay attention to. So end of my rant. Bottom line, I think the food stocks are cheap. People who are, you know, use their SNAP benefits to buy food in the past, we’ll still be able to do that. People who are living paycheck to paycheck will still have to eat. So that’s why I’m buying food stocks.

Rachel: All right, so, as we go into a seasonally strong period of the year, I think that’s what November, December into January is. Do you think there’s any other sectors besides that energy and food that are going to pop up? What are you looking at?

Jeff: Well, yeah, but let’s talk about this seasonal strengthening for a second. Seasonality has not been that good this year in terms of the market following it. We were all expecting seasonal weakness in September. That didn’t happen. We were all expecting seasonal weakness in October. That didn’t happen. We’re all expecting seasonal strength November, December. And I know there’s a lot of folks on TV that talk about, we’ve got through the worst part of the year without any damage at all. So now it’s off to the races. And for the next four or five months, we’re going to scream higher.

That seems counterintuitive to me. I think if seasonality didn’t play out for September, October, counting on it playing out for November and December may not be the best thing out there. And I’m not trying to preach a bearish tune here.

Rachel: I think you often say that the market rarely does what everybody thinks it’s going to do, right? The market doesn’t like to do that.

Jeff: No, the market likes to mess with people. The market gods are a funny bunch and they’ll throw roadblocks up where you least expect them. And the interesting thing is, and we’ve talked about this before, you have, the indices are all at all time highs, but there are many more stocks that are trading below their 50-day moving average than there are above their 50-day moving average. So while the indexes themselves are trading at all time highs, it’s reflected by fewer and fewer stocks that are participating.

If you had said several weeks ago that the S&P 500 would be at an all-time high, but Meta would be more than 20 % below its all-time high, lot of people would have questioned how that’s possible, but that’s exactly what’s happening. Or that 57 % of the stocks in the index are trading below its 50-day moving average. That just seems really odd. So we have had seasonal weakness in a lot of names. So maybe we’ve become a market where we’re not paying as close attention or participating as much in the broad index, but rather on the individual stocks. So we’re going to find opportunities in sectors like that. Energy stocks, again, being one of my favorite here. Food stocks being one of my favorite consumer cyclicals. Utilities even. Utilities, if you look at the market basket of utilities, a lot of them had done very well, but a lot of them haven’t done so well.

So I guess what I’m saying is I think regardless what the market does here, I think there’s a large swath of the market that has to play catch up, that has to either get positive on the year or take the baton from the tech stocks and start leading the market. I think that’s most likely to happen rather than just a continuation of tech stocks moving up, strong stocks getting stronger, weak stocks getting weaker, that sort of thing. At some point, those rubber bands, they’re so far stretched right now, they have to snap back at some point.

And I think we will see that. And with everybody discounting the bubble in AI, everybody’s saying, hey, I know it looks like 22,000, but we’re smarter now. We know how to do this. Or I know that we’ve got a long runway. That’s everybody’s favorite phrase right now. It’s yes, it’s a bubble, but we’ve got a long runway. Maybe the runway is not quite as long as most folks think it is. So if everybody’s talking about a long runway.

Maybe it’s a very short runway. Maybe it’s like flying into Tahoe and you got to put those brakes on a little bit faster.

Rachel: My goodness. Well, we’re talking about the 50-day moving averages and how a lot of stocks are below them. So we have a question from a reader and Karl asks, could you explain what technicals you look for and how you find them?

Jeff: What technicals I look for and how I find them. Well, I use a lot of basic indicators. They’re oscillators, which show the strength or weakness of a particular trend. I use things like MACD, which shows the moving average convergence, divergence. Don’t get caught up on that. It’s basically a measure of momentum. And I look for divergences. This is how I use every technical indicator that I follow, is I look for things that are normal conditions and I look for abnormalities in those indicators. So if a stock is moving higher and higher and higher, but the momentum indicators, the MACD, the RSI, the CCI are falling, then that tells me that the strength of that uptrend is weakening and I should be looking for a reversal at some point. If I’ve got stocks that are falling and falling and falling, but all of those indicators I just talked about are moving higher, then that’s called positive divergence and I’ll look for the potential for a stock to reverse off of that. I look at moving averages, the nine-day exponential, the 20-day exponential and the 50-day moving average are the three go-to moving averages that I use and I look for a stock’s historical relationship to those moving averages and anytime it gets outside of the normal.

So if the stock is trading extremely far above its moving averages where it trades, let’s say for example, it normally trades within 10% of its 50-day moving average, and all of a sudden it’s 25% or 30 % above. That tells me it’s an overbought condition. We’re probably going to see a reversal to the downside. Or a consolidation period that gives time for the moving averages to catch up to it. In other words, there’s not a lot more upside potential until things return to normal. Same thing if it’s trading far below its moving averages. So it’s all relationships.

I’ll look at how certain sectors trade relative to the S&P 500. I wrote an essay for Market Minute this morning, in fact, where I talked about the energy stocks relative to the S&P 500. They’re trading at its lowest relative value to the S&P in four years. So the energy stocks relative to the S&P are cheaper than they’ve been in the past four years. That seems significant to me. Whereas if you look at the tech stocks, the tech stocks are more expensive than they’ve been in the past four years.

So if I’m looking to buy low and sell high, I’m more likely to be a buyer of the energy, not so much of the tech. So that’s what I look at. Technical indicators, you can find them anywhere. Whatever charting service you use, I use stock charts, but you can use any of them. And they have those as little additions that you can put onto the chart and show you where it’s at. But really, it’s a matter of looking at it relative to its history and relative to whatever other factors that indicator is contingent with.

Rachel: Thank you for that great answer for Karl, Jeff. I guess for the last minute or so here, next time we chat, it’s going to be December, which is crazy to me. This year has gone by really fast. So what do you see ahead for this month, for December going into the new year? I know, big question.

Jeff: Well, I talked about the dollar rallying. I think I started talking about it in September, and so far it has. And it looks like it’s starting to pick up steam. I think that is the most surprising thing. Folks are going to look at the end of the year and go, my goodness, I had no idea the dollar was going to rally like that. We picked it up in September, I said, looks to me like the dollar is bottoming. We used all these indicators that I talked about with Karl’s question there to explain why I thought the dollar was oversold and ready to rally and now we’re seeing the effects of that. So I think the dollar moves higher between now and the end of the year. Unfortunately, I think that means gold probably moves lower. Other currencies obviously will move lower. It probably means that interest rates are headed higher as well. I think we have a lot of things going on that could be kind of the fly in the ointment for the stock market.

Coming up on Thursday, the Supreme Court is going to take up the case about the tariffs, a case that the tariffs are unconstitutional and whatever. So the Supreme Court will hear arguments about that. And that probably is going to take up a couple of weeks. But once we get a decision on that, for those couple of weeks, it’s going to be kind of cloud hanging over the market, if you will. The market doesn’t like uncertainty, and that adds a little bit of uncertainty.

Because I believe the market has all of a sudden looked at tariffs now as being a positive thing for stocks, which is a little odd because several months ago it was completely the opposite. But if the Supreme Court strikes that down, then, and we wind up having to return several hundred billion dollars in tariff revenue, that’s clearly going to be negative for the US fiscal deficit. And that is probably negative for bonds.

It might be positive for things like retail stocks, know, folks like Abercrombie and Fitch ANF, Lululemon that are very affected by tariff rates. So that might be a positive because those stocks are in the gutter as well. That might be another sector you take a look at. Christmas coming up, obviously retail stocks might be something that you look to move into. Some of the beaten down ones and the cheap ones. It’s interesting, there’s a lot of stocks that right now are trading in single digit price earnings ratios. Some of them are retail, some of them are energy, some of them are food. They’re single digit price earnings and they’re 5 % plus dividend payers. So there’s a lot of cheap stocks out there, but they just can’t get any love. The cheap stocks just keep getting cheaper. But it has been my experience in the past, and I’ve been doing this long enough to be able to say this with confidence.

When you buy stocks that are cheap, your risk is relatively low, although there is risk, but it’s relatively low, and the upside potential could be significant. I often talk about, you know, the last bubble we went through was the dot com bubble. And back then, my biggest position going into the middle of 2000 was Cooper Tire and Rubber. Every client I had had a bunch of that stock. I had a bunch of the stock. My firm had a bunch of the stock, Cooper Tire and Rubber.

It was a tire manufacturer, but it had been beaten down. And it was trading at six times earnings, it paid a 6% dividend, and it was trading at $9 a share at early 2000. It dipped as low as $6 a share. And I had customers that were threatening to leave me because I wasn’t participating with Yahoo and Cisco and Pets.com and all this other sort of stuff. I was in Cooper tire and rubber. But when that internet bubble finally popped, and some sense of rationale

came back into the markets. As all those internet stocks deflated, Cooper Tire and Rubber tripled in about six months. So that looked really good. So I think you’re going to have a similar opportunity, because what’s happened over the past several months is you’ve had all these AI stocks trading at these phenomenal momentum moves and making higher highs and higher highs and higher highs and stretching beyond whatever imagination would allow them to. Meanwhile.

The value stocks, the Cooper tire and rubbers of this particular era can’t get any love. And so they’ve been beaten down. So I go back to that premise that as money comes out of these inflated stocks, it’s going to go into the deflated ones. So be a little patient with it because it doesn’t happen overnight, but it does happen. We’ve seen it often enough. We’ve seen these cycles often enough.

So that would be my best advice for the year is buy value right now. I know it’s as contrary in a bet as you can make right now because nobody likes value except me and maybe a handful of other folks. But the other thing to think about is Warren Buffett, Berkshire Hathaway is $382 billion in cash. 40 % of the market capitalization of Berkshire Hathaway is in cash right now. That’s the largest cash position he’s ever held. So if the smartest investor in the world ever, Warren Buffett, widely accepted as that, can’t find things to buy in this market enough to where he’s comfortable putting his big cash hoard to work. Take that as a sign of maybe being a little cautious here.

Rachel: I feel like that is excellent advice, Jeff, and I, for one, am following it. And I really do hope that the tariff situation gets sorted out because I recently paid 90-some dollars for a package from New Zealand and I was not happy about that.

Jeff: Well, buy America then.

Rachel: But America doesn’t have linen clothes in the way other parts of the world do. Ask your wife.

Jeff: Well, all right, then you’re kind of screwed.

Rachel: Well, Jeff, that’s really all we have time for today. Always a pleasure chatting with you on these podcasts. And when we get together next time in December, maybe we’ll have you open up stock charts and go through some of those technicals for our friend Karl.

Jeff: That’s not a bad idea. Thank you, Rachel. I appreciate the time.

Rachel: Have a great day.

Jeff: You too. Bye bye.


  •  

Jeff Clark Thinks There’s a Massive Reversion-to-the-Mean Setting Up

Dear Reader,

Rachel Bodden, Jeff Clark’s senior managing editor here…

Our next podcast is in…

Today, Jeff tells us his thoughts on the markets, where he thinks we’re headed, and talks some good sectors to place your money…

Check it out below, or see the transcript on the website or the Jeff Clark Mobile App (you can find the Android version here and the Apple version here).

And remember, send us your questions, feedback, or topics you want us to cover in the future at feedback@jeffclarktrader.com.

Regards,

Rachel Bodden signature

Rachel Bodden
Senior Managing Editor, Jeff Clark Trader

Transcript

Rachel Bodden: Hello, welcome back to another podcast with Jeff Clark. Last time we met was mid-August and the markets were at all-time highs and Jeff was sitting largely in cash. A lot of stuff has happened since then, including a Fed meeting. So Jeff, what’s the latest?

Jeff Clark: Still sitting largely in cash. You know, it’s interesting because, you know, as we headed into September, everybody recognizes the seasonal weakness that typically occurs in September. you know, seasonality hasn’t really worked very well this year and it did not work in September at all. The S &P I think is up almost 4%.

But the same conditions that had me cautious back in August, and also July and also June have me cautious still. And the primary concern that I have is as the market has been running up, as the indexes have been running up since May, fewer and fewer and fewer stocks are participating. And so what’s happened is here we are as we’re approaching October, which is a seasonally poor month, you actually have, think something like 44 % of the stocks in the S &P 500 are trading below their 50-day moving averages. That’s a sign of relative weakness. know, back in May, you had almost 80 % that were trading above their 50-day moving averages. So what has happened is the strong stocks have gotten stronger and the weak stocks have gotten weaker. So where you normally have this typical ebb and flow of the market, it’s all ebb on one side, and it’s all add to the downside for the other section.

You know, I’ve been preaching this for several weeks now. I do think there is a massive reversion-to-the-mean setting up where you’re going to see some money come out of the hot names and move into the lagging stocks. So while I say I’m largely in cash, the positions I have been taking have been mostly to play some of the lagging stocks in anticipation of a catch-up move. And I’m being very, very careful when I say that because I do think if the performing stocks, the technology, the semiconductors, the artificial intelligence stocks, all the names that have been hot, as money comes out of that, it might not automatically start pushing into the lagging sectors right away. We saw a little of that when we got some weakness last week.

Technology stocks sold off and you saw some strength in the energy sector, you saw some strength in the food stocks, but not that much. And then of course, we’ve reversed that obviously in just the past couple of days as the technology stocks are at all time highs again. But I do think that change is coming, but I think we can take our time positioning for that. So my expectation is as we go through October, which again is supposed to be a seasonally weak month, we’ll take advantage of dips in the market and dips in those sectors that have been lagging to add new exposure from the long side.

On the short side of things, shorting this is tricky and a lot of folks it’s not suitable for and so oftentimes you’re better off just sitting in cash rather than trying to short. But if you do have the capability and the emotional stability to try to short stocks, there’s a lot of stocks now that after we had that dip last week, we’re getting this push back up now. lot of those stocks are set to make lower highs and if they do make lower highs and start to roll over again, that’s usually a really, really, really strong setup for a downside move for the next couple of weeks. So I’m looking for stocks to short. A lot of those are in the semiconductor and technology names, but I’m not, I haven’t jumped into that just yet, but I do think as we close out September and we get the quarter in window dressing out of the way, we’ll open up for some seasonal weakness as we get into October.

How’s that for a long-winded answer to that question?

Rachel: It’s a great answer. What were the things that happened in the Fed meeting that were most notable and that you were waiting on to sort of shake out in the markets?

Jeff: I don’t think anything was surprising with that. The Fed lowered interest rates like they thought they would. My stance has always been that lowering short-term interest rates or lowering the short-term target for interest rates doesn’t do anything to the long-term side if you don’t have quantitative easing going on. So I won’t belabor that point much more other than to say that the Fed has control of the short-term target for Fed funds rates, but it’s the bond market controls the long-term rates.

And as we saw last September when they dropped interest rates in the short term, long term rates went up. We’ve seen the same thing. Two weeks ago, the Fed dropped short term interest rates by 25 basis points. Long term rates have actually gone up. They haven’t gone significantly higher yet, but as you know, we’re starting to see hints of inflation coming back. You know, the PCE came out on Friday at 0.3, which was totally expected, but that’s a 3.6 % annual inflation rate. The target is 2%. So if the Fed’s target is almost half of where inflation is right now, or put it another way, inflation is double what the Fed’s target is.

It’s hard to justify an easing stance and the market has been pricing in two more additional cuts throughout the rest of this year. I don’t know if that actually comes to pass. It’s hard to say, but I don’t think I think at this point that the market has discounted the potential for future rate cuts. They don’t get those rate cuts.

There might be a little bit of dislocation on the market. And even if they do get those right cuts, it’s not going to affect the long end. And I’ve shown this oftentimes to subscribers. When you look at the yield curve and you look at a very long term chart of the yield curve, and we’ve looked at 20, 30, 40 years of yield curve, we’re at the point where the yield curve has gone from an inverted state to more of an upward slope. And the four times that’s happened in the past, it’s always preceded a difficult time in the stock market, a difficult time in the economy. so I, even though four times is not, you know, it’s not a big number of examples we can cite, but those four times, the only four times in my entire lifetime they’ve happened. I got to think that maybe this is the fifth time and it’s probably going to happen also. So I am looking for continued disruption in the market, but just in a different nature than what we’ve seen. Like I said, I think there’s going to be some stocks that perform well because I don’t think the money is going to leave the market.

So as folks sell out of the tech names that are trading for 150, 200, 300 times earnings or 50 times sales or these really astronomical numbers, money comes out of that. They will go into the brick and mortars that haven’t done anything. The stocks that are trading eight, nine, 10 times earnings that have not participated in this rally.

Rachel: So let’s jump a little bit longer term. What do you see the market doing in six, eight months from now?

Jeff: Well, I think the broad averages are going to be lower. I think 2026 is going to be a difficult year for the stock market. This, I don’t want to appear too bearish because when the market does have hiccups like that, that’s wonderful opportunities. You know, I often say everybody can make money in a bull market, but it’s the decisions that you make in a bear market under difficult conditions that can actually make you rich.

And so I look forward to difficult conditions. I look forward to a market that sells off because it gives you the opportunity to put money to work at a much favorable valuation measure. Right now, it seems like almost everything is expensive. And when almost everything is expensive, and I might’ve said this last month, it pays to hold cash.

The only thing that’s cheap right now is the US dollar. So I mean, you look at a chart of the US dollar, the US dollar is sitting at a multi-year low. So there’s a pretty good argument that maybe everything else needs to come down a little bit while the dollar strengthens a little bit. And that includes gold. And I hate to say that because I sold out of my gold a few months ago. I think I was out of my last, I still own my physical gold, but my paper gold, the GLD and the various gold stocks, I’ve been out of for a couple of months now. So yeah, I have missed this fantastic move that’s occurred, but now it’s gotten extreme. We’ve reached a parabolic move up in the gold sector and parabolic moves are unsustainable and they always end badly. And so I’m waiting for that to come home to roost. So, I mean, that’s what I see coming.

I think six months from now, the market’s going to look entirely different than it does right now. I think you’re going to see the hot stocks come down a little bit, and you’re going to see the stocks that have been just cast aside because they haven’t done anything, they’re going to perform well. And when I say cast aside because they haven’t done anything, I think in that group is energy stocks.

There are consumer staples that are in that group. There’s food stocks that are in that group. I mean, I’m looking at a handful of grocery chains and I look at these valuations, they’re trading six, seven times earnings. I don’t recall seeing anything like that since looking at a similar situation way back in 2000 where you had the market going gangbusters, but then you had the staples and you had the food stocks and you had the energy stocks not doing much of anything. And that changed obviously when the dot com bubble bust. And I’m not saying necessarily that we have a bubble that has to go bust here in order for that to happen. But I do think, you know, we’ve got a long time without a reversion-to-the-mean correction. We’ve got a long time where momentum has pushed the hot stocks way up and push the cold stocks way down. And we are way overdue for a reversal of that sort of action.

Rachel: So, I mean, asking for a friend if potentially someone has ridden those gold stocks, you know, through this parabolic move, should we maybe trim profits?

Jeff: Well, yeah, but also, know, I admittedly, I have missed out on the move the last couple of months. I haven’t been involved in it. So I can look at it from this vantage point and the gold sector haven’t helped me on this, but the gold sector, if I ever have the guts to short something in that sector, it looks kind of like we’re heading for that opportunity. I try not to short into a parabolic move because you just never know when that’s going to end, but they do end and when they end they tend to erase a lot. The problem if you are chasing stocks into a parabolic move, there’s no way to determine an adequate support level because the stock has never backed off.

Normally when you’ve got a regular stock that rallies and comes down, rallies and comes down, rallies and comes down, you can trace out some support levels. When you have a parabolic move, there isn’t any support level. So when it starts to fall, you’re pretty much clueless as to where buyers might start stepping up again. That’s the danger in a parabolic move, which is why a lot of times those parabolic moves tend to reverse 100 % of the move once they start to correct.

That I think is in store for the gold sector. Granted, three years, four years, five years from now, most gold stocks I think will be higher than where they are right now, just as I said three years, four years, five years ago. I just think three, four, five months from now, they’re going to look a lot different than they do today.

Rachel: I mean, we don’t have to look that far into the past to see a situation where you were like, things are going to fall, things are going to fall, and people didn’t want to hear that. I mean, I’m thinking about the 2022 Tech Rag. You did really quite well predicting that and helping your subscribers through that. Do see a similar kind of situation coming to pass?

Jeff: Yeah, but it’s not such a matter of predicting. I mean, granted, that’s sort of the nature of the game here is we’re supposed to predict where we think things are going. But the market sort of tells you that when things are abnormal, when things don’t go as they normally should, I try to pay very close attention to that.

And when popular opinion is okay with things not going as they normally should. So one of the things I thought was curious over the past couple of weeks is you have a lot of folks on CNBC and Bloomberg and Fox Business all talking about the AI stocks and talking about, you know, the, and granted they’ve been magnificent performers and they’ve been wonderful rallies, but they talk about the justification as to why some of these stocks should trade 100 times sales.

Nothing logically should trade 100 times sales. I mean, we’ll just back that up a little bit. Granted, you say, yes, it’s high growth. And yes, there’s all these wonderful possibilities that exist with that, that’s wonderful, but how far out in time do you want to price that in? And when you go back to 2000 and you look at the dot com bubble, it was the same thing. You had Cisco and Lucent and Nortel and Broadcom and all these stocks just trading at these unbelievable multiples and folks would say, hey, it’s a different world right now, so we have to use different metrics to measure it. Not really, still, a stock is basically priced based on its forecasted earnings potential. Right now we’re forecasting earnings so far into the future on some of these names that doesn’t make sense to buy them at 150 times sales or 200 times earnings or whatever multiple you want. And what’s happening is these folks on TV are saying well no you have to measure it by a different way.

Remember back in 2000, we had to measure dot com stocks in a different way too. We had to measure it based on page views or eyeballs or all these weird old things. Ultimately, it all boils down to earnings. And when the earnings don’t show up or they don’t show up fast enough, stock prices get hit. And the danger is, back in 2000, it wasn’t so much people buying into that big dot com run up that caused the problem. It was when stock prices started to correct.

This is very important to understand. Back in the dot com era, when stock prices started to correct, it wasn’t people suffering is because they bought into the parabolic move higher. It was people suffering because they kept trying to average down on their positions. So stocks that they bought up here, it would fall a little bit. They plow more money in. would fall a little bit. They plow more money in. It would fall a little bit. They plow more money in. And then by the time everything got wiped out, they were 100 % invested and they got totally shafted, I guess is the word.

That’s sort of the behavior I think we might be setting up for right now when you look at these AI stocks. You see these magnificent runs and it’s fantastic as it’s happened, but as they start to come down, folks are going to start averaging in. They’re going to say, it’s my chance to buy XYZ at this price or whatever AI at this price. And as it continues to fall, remember those parabolic moves, who knows where the support comes in, it just tends to keep falling. They’re going to wind up averaging down on losing positions and winding up with a much larger loss than they otherwise would have had.

Rachel: So what’s the best move, so we don’t average down into oblivion…

Jeff: The act of the exasperated sigh. Again, I’m not trying to be Nostradamus here. I don’t see gloom and doom, but I like the idea of the potential to be able to buy some of these assets at much cheaper prices. And that’s why I’m cash heavy right now. That’s why I was cash heavy last month.

So yeah, I look like an idiot for the past couple of months because I’ve been preaching caution, but at the same time, I know prices are going to come in. I know we’re going to have a chance to buy these stocks at cheaper prices. Yeah, maybe I missed the shot at buying the stock at 20. It goes to 25 or 30 because I think it’s going to 15. I’ll hold out 15.

Rachel: Let’s just keep telling our readers to put down the ice cream and not downsize into oblivion. I’ve heard of more than one great investor getting really wrecked by following names that they thought would recover and go back up and just never did.

Jeff: Well, yeah, there’s I mean, the internet is forever and you can go on YouTube and you can find any number of pitchmen from 2000, 2001 talking about these wonderful stocks and how you buy it to buy them and the future of all these and so many of them don’t exist anymore. So there’s that.

Rachel: What’s your favorite strategy for right now?

Jeff: Right now, like I said, I’m hoping to use weakness in certain sectors to position for the long side because I do think you’ll see strength in certain sectors. Energy stocks look good to me going out several months. If you say, know, where are the opportunities for the next six months, I think energy stocks, food stocks. I think there’s some retail stocks.

I’ve recently been talking about Target, you know buying Target. Target’s a beaten down retailer, but it’s trading at 11 times earnings, which I can’t recall the last time Target traded 11 times earnings, and I think it has a 5 % dividend.

That seems to me to be pretty cheap, know, relative to, you know, competitors in the space. If you look at Walmart or you look at Costco or you look at some of the other big box retailers that out there. So Target looks cheap to me. I’m not just arbitrarily jumping in and buying stuff, but I think that looks cheap. I think there’s a lot of food stocks that look cheap.

I won’t give the names out here because I’ll save that for subscribers, but we’ve had a couple of food positions that we’ve done decently well on recently. And those have been beaten down names. I think energy stocks are in the same group as well. I used to talk bullishly about the healthcare stocks, but they’ve had such a phenomenal game of catch-up since last month when we talked about them, I think, in the podcasts last month that I kind of hold back now because they’ve run up 25, 30 % many of them.

So I’d wait for those to come in a little bit. There’s nothing in the semiconductor space I can find much value in. I think that’s not that that sector has to come in and there’s nothing on the gold space that I can find much value in. And those have been the two hottest sectors. So sort of, you know, I’m looking kind of like an idiot for not participating in that in the last two months, but I think we’ll have better opportunities to buy into those sectors in the months ahead.

Rachel: Sounds great Jeff. I have 2 questions from the same newbie trader and I think that you can help with him. His name is Steve and his 1st question is pretty standard, but I think it’s always kind of worth repeating. He asks, what do you recommend my initial deposit be?

Jeff: Well, that’s an impossible question to ask because I don’t know the person’s personal circumstances. If you employ the sorts of strategies that I do, where I trade options, and this is probably a good time to talk about how I trade options. I’m a very conservative option trader. What I try to do is if I like a stock, let’s say I like Target, and Target goes for something like $88 a share right now. So 100 shares of Target would cost me $8,800.

What I try to do is I figure out what I’m willing to risk on target. So if I buy a hundred shares in stock at $88, so it’s 8,800 bucks, and maybe I’m willing to risk a 10 % move. So $880. So I’d be willing to put in 8,800 for 100 shares of target, and I’m willing to risk 10%. So I would suffer a loss of 10 % and I’d say, okay, I’m wrong, I’m out of the trade. That’s 880 bucks.

Rather than buying the stock, I would take that 880 or probably a little bit less than that, and I’d go over to the option market and I’d see if there’s an option trade that I can make using that $880 that allows me to increase my profit potential while limiting my risk.

Oftentimes what I’ll do is I’ll cut that in half. I’ll take $440 over. So now no matter what happens, I’m going to lose less in my option trade than I was willing to risk on the stock trade. And then in the option market, I can probably buy two or three or four option contracts, call option contracts, giving me the right to buy target. So I’ll utilize that type of a strategy. That way I’m using $440 in my option trade. The balance of that, the other as I work out to $8,360 is sitting nice and tidy in my bank account or money market fund or whatever, earning whatever interest, and I still have a similar position, but my risk is dramatically reduced.

That type of trading, it’s conservative option trading, but it requires a much smaller account size. So I would say, if you have $10,000 or so, if you’re starting off with $10,000, then you can, using that as a good example, implement a lot of the buying options strategies that we utilize in my services. If you start talking about uncovered options, and we sell a lot of uncovered puts, we’ve done combination strategies, that sort of thing.

Most brokerage firms require you have at least $10,000 to do that. And I think it’s probably more conducive if you have closer to $25,000 because that opens up the opportunity of doing spreads and straddles and some of the more complex option combinations. So minimum 10,000.

Preferably 25,000 and it’s from there. But really it’s how much do you want to risk on any one position? I usually tell folks not to risk more than two or 3 % of your account on any one position. And if you utilize the strategy the way I’ve just described, or you’re whatever it is you’re willing to risk and you’re taking that over to the options market and just using a portion of it, then I think you can do that with a small account.

Rachel: You inadvertently answered a second question as well. So good on you, Jeff. Way to go. Incredible. Well, that’s really all we have time for for today’s podcast. But I look forward to getting together with you next month and doing the same thing. And remember, if you have questions, comments, feedback, we absolutely need to have it here so we can answer more things for you guys. So remember, write that to us at feedback at jeffclarktrader.com.

And we’ll answer your question in a future edition of the podcast.

Jeff: Yeah, and I’ll also say if there’s something you want me to talk about that we haven’t talked about before, hit us up. Let us know that that’s the subject matter you’d like to see discussed. Because I don’t think we talk about Bitcoin much. We don’t talk about currencies or anything like that much. Everything’s out there. So we can do anything.

Rachel: So, let us know what you want to hear. We’re doing this for you guys. Thanks Jeff.

Jeff: Thank you, Rachel. Take care.

  •  

Why Jeff Clark Is Cash-Heavy Right Now

Dear Reader,

Rachel Bodden, Jeff Clark’s senior managing editor here…

Our next podcast is in… and it’s a good one.

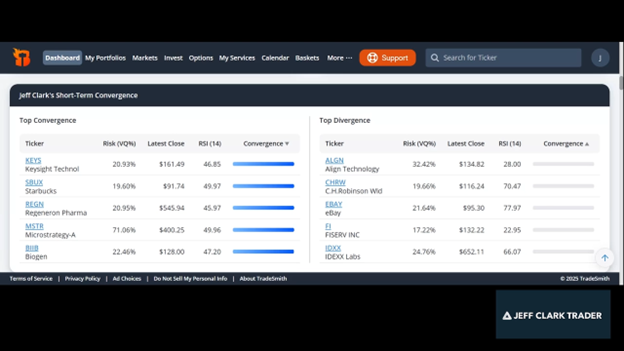
Today, Jeff tells us his thoughts on the markets, takes us behind the scenes of how he uses the new TradeSmith widget, and answers some subscriber questions.

And remember, let us know your thoughts – good or bad – or send us questions at feedback@jeffclarktrader.com.

Check it out below, or see the transcript on the website or the Jeff Clark Mobile App (you can find the Android version here and the Apple version here).


Regards,

Rachel Bodden signature

Rachel Bodden
Senior Managing Editor, Jeff Clark Trader

Transcript

Rachel Bodden: Hi, my name is Rachel Bodden. Welcome back to another podcast with master trader Jeff Clark. Today we’re going to have a rundown of what Jeff sees in the markets. And then we’re going to take you through the new TradeSmith widget and show how that can be applied to your trading.

And if we have a little bit of time, we’re going to go through the feedback that you have been sending to us. And we’d like to thank you for sending so much positive feedback on this series. We love to do it and we’re happy to continue. But remember, we can’t answer questions if you don’t send anything in. Good, bad, or constructive criticism, we’re all open to it.

So, Jeff, what’s the market doing for you today?

Jeff Clark: Doing for me, not much. Doing for everybody else seems to be working out okay. As we sit here on what day is it? Is it Tuesday? On a Tuesday afternoon, the markets are all time highs. The S&P is just bucking the seasonal trends of bearishness. It’s bucking the Buffett indicator. It’s bucking everything. So the momentum here is, know, obviously the momentum is with the bulls. And that’s a little bit frustrating for me since I am not a momentum trader.

So I’ve been largely on the sidelines, you know, just a few trades here and there and we’re doing okay with them. But, you know, it was interesting. I was having a phone conversation with a buddy of mine yesterday and I was talking about, you know, my own frustration with the market, you know, it just doesn’t seem to get anything going. And he was equally as frustrated. Now this person is a technology fund manager and I thought he would be having a great time, you know, cause it’s a tech market.

But he was telling me one of his largest positions is IBM. And if you look at a chart of IBM, IBM peaked six weeks ago. He owns Microsoft, which has been a good performer. He owns Meta, which has been a good performer. But he’s got a handful of semiconductor stocks like Marvell Technologies, which is down on the year.

He’s got, I don’t know, he listed a whole bunch of things that are actually down on the year. And surprised me a little bit. And it was really just sort of illustrative of that, the fact that, you know, this market has been moving higher with fewer and fewer stocks participating.

That’s usually a poor sign for forward returns, but while it’s happening, obviously, if you are chasing momentum here, you’re doing pretty well. If you’re buying ALAB, which is up 300 % this year, you’re doing great. If you’re buying Nvidia, which is up 100 % off of the April lows, you’re doing great. But the thing that I would want to impart on folks, if I’m talking to my mother or I’m talking to my brothers about this, I’m focusing on the risk side of things. And when you buy stocks that are trading 150 to 200 times earnings that have already tripled in value, you’re putting up a lot of risk to capture that extra return. And I don’t think the potential rewards at this point justify that.

I am going to err on the side of being too conservative. And I know that’s going to frustrate a lot of folks as you know, they read the headlines every day and it’s stock markets going straight up. But at the same time, we’ve been in this position before we were in something similar in February, we saw something similar happen at the end of 2021. And the forward returns of the market tend to be what’s the word suboptimal. So I’m not looking necessarily for a crash.

I was very bearish a few months ago, I thought really that we would have a generational buying opportunity come around September, October. I don’t think we’ll get that low. think anything significant is probably going to be pushed back until maybe January, February, something along those lines. But I still, I find it very, very difficult as a fundamental analysis analyst to look at the S&P trading 24 times earnings and think it’s time to pile into the market.

And as a technical analyst looking at some of these stocks that are so far above all of the various moving averages and the risk, the rubber band stretch so far, it’s really hard. So I am cash heavy at the moment, which looks like a fool’s position right now, but I have a feeling it’ll look like a pretty smart position.

not too long from now. And I’ll point out that there’s an awful lot of smart people on Wall Street that are very cash heavy as well. Warren Buffett being one, Steve Cohen being another, Michael Burr being another. I don’t mind sitting in those people’s company. So I am cautious on the market. I have sort of given up on the idea of shorting anything here with the hopes of making money as things fall because the market is not.

It’s not conducive to short selling at the moment. And it’s difficult to make money on the short side because you’re constantly second guessing yourself. You’re constantly thinking, do I let this one run or do I take the quick profits off the table?

And usually the smart move is to take the quick profits on a short trade. But again, in this particular market, it’s hard to battle that momentum. So sitting with a lot of cash, taking a shot every now and then, we’re doing okay on those shots that we take, but I am not being aggressive here at all.

Rachel: I mean, you don’t survive four decades as an options trader without being really good on your risk management. So I think that’s one of the reasons people gravitate towards you. You tell them to put down the ice cream when they don’t want to hear it, you know, and you have been proven to be right even when people get frustrated. So you’re doing something right, Jeff.

Jeff: Well, yeah, there’s some truth to that, but always in the back of my head, it’s, okay, what can I be doing different to add value to help subscribers profit a little bit better? And the problem that I’m facing right now is coming up with those opportunities that make sense to me from a risk reward standpoint. I often say that I usually only make recommendations that I would be willing to recommend to my own mother. I can expand that a little bit since my mom is in her mid-80s.

I could say, I’ll make recommendations for folks in their sixties or their fifties, but even then it’s very, very difficult for me to come up with ideas that make sense from a risk reward perspective. There’s just the things that are moving right now are the things that have the most risk attached to them. And it’s paying off, you know, it’s like sitting down at the roulette wheel and you know, black two comes up all the time. You just keep betting on black two.

But the odds of that happening are getting thinner and thinner and thinner. Just for me, it doesn’t make a lot of sense to take a lot of risk in the market at this particular juncture.

Rachel: I think that’s very, very fair. And I know I’m biased, but I’ve been in this industry a while, worked with a lot of really fantastic and not so fantastic editors, but I’d always prefer my editor err on the side of caution. I don’t want you to just make trades just to make them. So I always want to know that you have my best interest at heart. And I know that you do. And I know that our subscribers know it as well. So I think that’s a really good point to transition to our new TradeSmith widget.

And how you would go through and sort of screen those companies so that our subscribers can maybe do that on their own if they want.

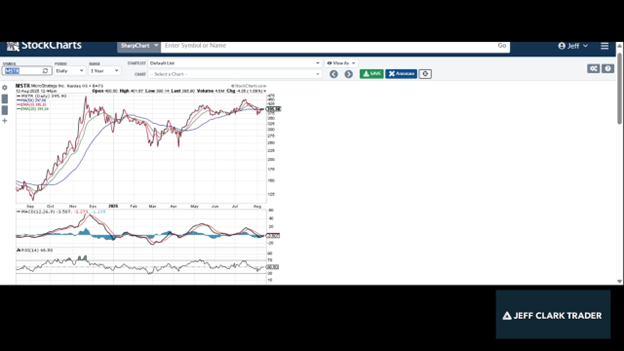
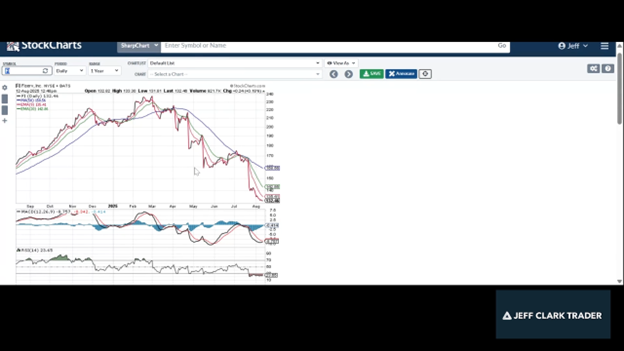
Jeff: Okay, well, just to introduce it a little bit to folks, it used to be that I would spend hours and hours and hours every Saturday morning and I would go through chart after chart after chart after chart, hundreds, maybe even thousands of them. I never sat down and really counted them. And it would take me a good portion of the day, eight, nine, 10 hours. And I would be hunting for charts that looked interesting to me. And as most of you know, my particular style, I trade two types of setups.

I trade what we call convergence setups, is where all of the various moving averages have come together. There’s a lot of energy building, and there’s a big move coming out of that. And I trade divergence pattern, which is basically the rubber band philosophy, which is, know, look for things that are extended far below the moving averages, look for them to snap back, or look for things that are far above their moving averages and look for them to come back down. And that’s my style of trading.

The momentum stuff I’ve never found a home in that. It’s not really my wheelhouse. So I concentrate on convergence and divergence. And I spend a lot of time going one by one through charts to do that. When I came on board with Tradesmith, Keith Kaplan said to me, he says, I can make your life so much easier. We’ll use technology and you just tell us what it is that you’re looking for. And if you can quantify it, that would be wonderful. And then we’ll put together a widget that will spit those names out. And you know, I’m cynical.

I’ve never been a systems trader because I think systems don’t evolve well enough. know, the market moves back and forth, people’s emotions change a little bit depending on how stretch conditions get. And so the technical formations, what worked six months ago doesn’t necessarily work today. And what works today isn’t going to work six months from now. So systems tend to be a little bit too rigid.

Keith assured me that he could find a workaround with that. And so far, think he has. Essentially, happens is TradeSmith developed a widget for me which uses my two philosophies, one of convergence, one of divergence, and it spits out those stocks that fit into those particular patterns that I’m looking for. So what I’ll share with you, let me share the screen here, I’ll show you what shows up on the TradeSmith website.

All right, here on the Tradesmith website, this is the dashboard section and it has Jeff’s short term convergence. This is really convergence and divergence screen, but we’ll just stick with the name as it is right now. So this shows up and shows the top five contenders for the convergence strategy and the top five contenders that their system spits out, their widget spits out on the divergence strategy.

So we’ll go one by one through the convergence. You don’t have to get into the weeds on this and know what the risk quotient is or the RSI or what all this blue stuff means or anything else. Just note the stocks that it lists. These are the stocks that the widget has spit out as being the most potentially profitable trades in the convergence philosophy that I subscribe to, and the divergence philosophy that I subscribe to.

So if you take a look at these top five and you just one by one go through and look at the charts on them and we’ll do that as well. me stop this for a second. Just note these, we’ve got keys, we’ve got Starbucks, we’ve got Regeneron Pharmaceutical, MicroStrategy and what is that, Biogen. So now that we’ve got that out there, let me stop sharing on this one and I’ll share another screen with you.

All right, so this is my stock charts screen. I’m just going to type in the first one that showed up on the convergence, and we can go one by one through these if you like. So this is Keysight Technologies, K-E-Y-S is the symbol. And you’ll see what I’m talking about when I talk about the convergence. You see these moving averages. These are the 50-day moving average in blue.

The 20-day exponential in green and the nine-day exponential in nine. These are the three that I pay the most attention to. You see they’re all converging together. So what that’s telling you is the stock is in a really tight trading range. It’s not going too far above or too far below. Everything is getting tight and there’s energy building for a big move. And if you look at the technical indicators, momentum indicators at the bottom of the chart here, you’ve got the MACD, the RSI and the CCI. Again, knowing what these do, not that important, but knowing that they’re all in neutral condition tells you that energy is building. It’s not overbought nor oversold. So you’ve got everything come together price-wise converging and everything coming together momentum-wise. All of these are converging. So there’s a big move coming in one direction or the other for keys.

Of course we don’t know which direction it’s headed. So in terms of the strategy that you might incorporate off of something like this, if you liked Keysight Technologies, if you thought this was a stock I absolutely have to own, then this is probably a good time to buy it because it’s on the verge of a big move one way or the other. And if you don’t mind paying 166 bucks a share for it, then it makes sense to own it. Keep in mind though, that there is risk to the downside because again, lot of energy, but we don’t know which direction it’s moving.

But if you had a bias towards it, if you thought the stock was a good fundamental stock down, I don’t know anything about this stock, by the way, so I’m not making a recommendation one way or the other, but you do have the potential for a big move. As an option trader, one of the things I would look at with this is I would go over the option market and I would price out and see what the calls at roughly a 165 strike price would cost and what the puts at a 165 strike price would cost. And if it’s not too expensive, I might buy one of each, you know, and play both sides.

So if I get a big move higher or a big move lower, big move higher, I profit off the call, big move lower, I profit off the put. So that gives me the potential for what we call a long straddle position. So that’s one of the ways I might trade something along these lines. Let me give you another example, some of the other stocks that were out there. Starbucks I looked at earlier, it didn’t look all that interesting to me. It hasn’t really been consolidating long enough. Everything’s tied together.

And all of the momentum indicators are in neutral, so it passes that test to be included in the widget. But I would probably wait for this chart to fill out a little bit more. Maybe if it’s stuck around this particular price level for the next two or three weeks, then we can look at possibly putting a trade together for it. Regeneron was another one on the convergence chart. And this looks interesting.

You can probably tell why I might be attracted to it because here again, you’ve got the stock that’s trading at a low level consolidation pattern. All the moving averages are tied together. Everything’s in neutral. And I would be willing to bet if I was taking a look at Regeneron fundamentally, it’s probably in the lower area of its valuation range. So this might be interesting from a buyer’s perspective. Maybe we’ve got some upside coming with it.

Another one that looked interesting that was on the chart here is MSTR.

 This is MicroStrategy, which we all know is Michael Saylor’s company. It’s basically a Bitcoin treasury company. They buy a bunch of Bitcoin and they sit on it. And you can see how it has consolidated here. We’re now in a very tight convergence pattern. The moving averages are very tight together. All the momentum indicators are neutral. So there’s a big move coming. What makes this particular one interesting is MicroStrategy tends to tip the hand as to where Bitcoin is headed. So if micro strategy breaks out to the upside, you might use that as an indication that Bitcoin is moving substantially higher. If micro strategy breaks down from here, you might use that as an indication that Bitcoin is probably headed lower. So you can use micro strategy in this case, whichever way it goes, as an indication of where Bitcoin is headed.

And then the final one on that convergence pattern is Biogen.

 Same thing as Regeneron, it’s in the biotech sector. And again, you’ve got this very tight, lot of energy building. This looks relatively attractive to me from a fundamental standpoint. It’s in the lower area of its valuation ranges and it is, like I said, developing a lot of energy. So there’s probably a big move coming one way or the other. If you like the idea of owning Biogen, this is probably a good time to buy it. I’m not making that recommendation. I’m just simply saying from a valuation standpoint and a potential movement standpoint, that’s what’s showing up in the widgets. Now the other ones on the widgets, those were, you know, share my screen once again.

Those were divergence categories on the widget. So we’ve got Align Technology, CH Robinson, eBay, Pfizer, and IDEX. Now these, rather than being stocks that are building a lot of energy where the moving averages have come together, these are where the moving averages are very far apart and where the relative strength is showing either oversold or overbought condition. For example, you can see RSI. 50 would be neutral, so much below 50, like Align Technologies at 28. That tells you it’s oversold. CH Robinson at 70, it’s a little bit overbought. eBay overbought. Fiserv oversold. IDEX overbought. I’m not going to go through all of them, but let me pick one that I thought looked really interesting. Fiserv is probably a good one.

Yeah, technology is my best friend. That was sarcasm if you didn’t catch that. All right. So there’s Biogen. Let me show you Fiserv. This one looks really interesting to me.

You can see how it’s oversold, right? All the moving averages are far apart and the stock is historically far below its 50-day moving average.

I like to see in a rubber band situation where I’m looking for a snapback move, I like to see this sort of a development where, you know, Pfizer typically trades within 10%, the 10 % range of its 50-day moving average. And you can see it’s probably something closer to almost 20 % at this point. So 50-days at 158, 132. So what is that? Maybe 18 % below its 50-day moving average. That’s an oversold condition. And you can see how far apart the moving averages are. Similar conditions in the past, you just go back to where it was in May and you can see the same sort of the thing.

The benefit of looking at stocks that are in this particular situation where they’re oversold, deeply oversold, or if we were overbought, would be deeply overbought, is there’s not a lot of energy here to keep that move going. So the downside risk here, I’m looking at the mid-May move, is relatively limited until things come back in line again, where everything comes together, you’ve got energy.

So here, once again, we’ve got an oversold condition. So this looks like the downside is relatively small. And if I look at the various momentum indicators, you’ve got the MACD deeply oversold. You’ve got the RSI deeply oversold, the CCI also oversold. You do have some positive divergence on the CCI, think I could see if I squint far enough. Positive divergence on the RSI and it’s starting to develop on the MACD. So I kind of like this setup for a move back towards the 50-day moving average. This was probably an earnings announcement that caused this stock to fall. I haven’t looked enough into it.

Like I said, this showed up on the screen this morning. So I kind of like this setup. This would be something that I would look to perhaps buy call options on. I might be tempted, depending on the premiums, to sell an uncovered put if the stock was cheap enough from a fundamental perspective. Again, the only time you sell uncovered puts, or the only stocks on which you sell uncovered puts, are stocks that you want to own and you sell puts at prices on where you’re willing to buy it. You don’t sell an uncovered put on a stock if you don’t want to own it. So if there’s no in the world, you’d want to own FiServ, you don’t sell an uncovered put on it.

But you could buy a speculative call option and if the price is right, perhaps make a decent trade along those lines. So that’s what I use this divergence side for. A lot of these trades right now, you know, they’re short term. We’re just looking for a move back towards the 50-day moving average and I’m just, I’m spit balling here, but if I look at the previous times where Fiserv got whacked, you know, got whacked here, it rallied back up to the 50-day, it got whacked again, it rallied back up to the 50-day, it got whacked again, didn’t quite make it to the 50-day, got to the 20, whacked again to the 50-day, whacked again. So a move to the 20-day gets us up to 142, a move to the 50-day, and this is declining, so probably be 150 over the next few weeks, a move up to 150. So stocks at 132.

I’ll take a bump up to 142 or I’ll take a bump up to 150. That seems to be the, may to be a pretty good risk reward set up when you don’t have a lot of downside potential. So I know I talked that covered it kind of quick, but hopefully that gives you an idea of how I would use the widget or how I do use the widget to come up with some of the trading ideas.

Rachel: That was incredibly informative even for me and I’ve been working with you for quite some time now. I loved being able to see that. So if you enjoyed seeing Jeff go through charts like that, let us know and we definitely need to have more and more ideas and what to talk to you about in our podcast. So help us help you. Jeff, would you like to go through the last few minutes of some questions from subscribers? All right.

Jeff: Sure, of course.

Rachel: Let me pull up some feedback and remember write to us at feedback@jeffclarktrader.com we love hearing from you and we’ll definitely get to you in a podcast or maybe we’ll start putting back the mailbag in Market Minute. All right this is from subscriber Michael B. “Jeff, over the years you’ve been an avid trader of gold and silver. However, in the last year these metals have had massive gains. What is your vision for the future trades of gold and silver over the rest of the year?”

Jeff: Okay, that’s a great question because I do love to trade gold and silver stocks and I’ve been relatively inactive in making recommendations in that. And if you pull up a chart of gold and silver, you’ll see that they did have a pretty good run, but they’ve been sort of consolidating for the past several weeks. So we’re in one of those consolidation patterns where there’s a big move coming, I think, in gold. And it’s just a matter of guessing which direction it goes. We’ve got a Fed meeting coming up in September and the odds are increasingly on the side of the Fed lowering interest rates. And I think gold has been holding up rallying and silver has been rallying in anticipation of the Fed lowering interest rates. Whether or not they do it, I won’t get into an argument. At the moment, I don’t think they will, but that my opinion could change on that.

The market, I believe gold is anticipating that happening. So if the Fed does in fact reduce interest rates late September, I don’t think gold does anything. It’s already done it the Fed doesn’t reduce interest rates in late September, then gold becomes disappointed and you’ve got some downside. Gold has also, from a contrarian perspective, become a pretty popular trade.

Lots of folks like to buy gold right now. You know, Costco is selling gold bars like crazy. Lots of folks are buying silver right now. Lots of folks are buying the gold and silver stocks. So from a contrarian perspective, it keeps me a little bit cautious. And also from a seasonal perspective, I’m a little bit cautious on it. In Delta Direct this week, we just took a small put position in the gold sector.

And really, it’s plainly the overstretched situation and potential for a downside move in the metals that will show up first in the stocks. And so I’m slightly bearish. I don’t like to be bearish on the gold stocks because I love them. think the long-term potential for them is quite good. But I’m also very aware that markets are emotional in the short term.

And right now, I think the emotion has gotten a little bit too far ahead of itself on the bull side for gold stocks. And I think it’s probably overdue for a smackdown. I wouldn’t trade heavy that way, but I would look for lower prices to generate a potential buying opportunity. And I think aggressive traders might look at taking a short position. I’ll also point out that one of the indicators I use is the bullish percent index for the gold sector. It hit 100. Meaning 100 % of the stocks in that index are trading with bullish technical patterns. A lot of folks would say, hey, that’s wonderful. But really, it’s a measure of overbought and oversold conditions. So when you have 100 % of the stocks in the sector trading in a bullish pattern, it’s an overbought condition. It can’t get better than that. So it can only get worse, which means.

When it turns lower, it’s going to generate a sell signal. And BPGDM sell signals, and buy signals, by the way, are really, they’ve got a very good track record. So once that flips over, once it backs off a little bit, we’re going to have a BPGDM sell signal, which ought to weigh down the gold sector. So my outlook, my immediate outlook is rather pessimistic for the short term, but I think it will open up a pretty good buying opportunity, which often happens this time of year. Seasonally, gold stocks tend to be weak in August, September, first part of October, and they tend to do very, very well the fourth quarter of the year and the first quarter of the next year. So I think we’ll have a really good buying opportunity somewhere in late September, early October, probably coincident with a disappointing Fed meeting.

Rachel: And Michael B, if you haven’t seen this morning’s Market Minute, Jeff writes all about that as well. So next one is from Michael J. And he says, “enjoy the podcast, keep them coming.” We’ll work on that. His question is, “do you follow cyclical trading and if not, why?”

Jeff: I’m guessing by cyclical he’s intimating that it’s seasonal as well. And yes, I do, because I do think that, you know, there’s plenty of evidence that proves that there is seasonality in the market. You know, there’s a reason stocks tend to do well, January, February, March, they tend to get weak in April. They do well again in the early summer, then they get weak in the fall, September and October. I think as a backdrop, that’s a pretty  good rule to work with. It’s not the dominant position. There’s lots of stocks that might be beaten up right now that seasonally would lead to more weakness, but look good from a technical formation that will probably do very well over the next several weeks. So I don’t want to make that the sole condition for it, but I try to pay attention to seasonality when I’m looking at making new recommendations, absolutely.

Rachel: Great. All right, next one is from subscriber Derek. “Hi Jeff, been a satisfied subscriber for a while now. On moving averages when charting, does simple moving average or exponential moving average matter all that much?”

Jeff: Well, that’s a loaded question. I’m going to say it doesn’t matter all that much because the difference is relatively insignificant. But what I have found is the majority of stocks, and I don’t know why this is, and it wasn’t the case 15 years ago when I first was getting really into moving averages, but it is the case right now that stocks tend to play a lot around the nine-day exponential moving average, the 20-day exponential, and the 50-day simple moving average.

If you were just to use all simple, you’re probably in the realm of coming up with the same sort of analysis that I would. Or if you used all simple moving averages, same thing. But if I’m looking for specific support and resistance areas, I think using the nine-day EMA gives me a better target. The 20-day gives me a better target, EMA. The 50-day simple gives me a better target.

It might be just a few pennies difference, but for whatever reason, it seems to be the case that those particular moving averages right now in this particular moment in time tend to be favored by the market. I think maybe that has something to do with the computer programmers running all the algorithms and everything else at the hedge funds. They punch in all those numbers and they use the 90 EMA, the 20-day EMA and the 50-day movement average. If they change back to simple, then we’ll adjust or if they change it to the eighth day or the 15th day or something else.

Rachel: Okay, we have our last question here from Kevin S. “Jeff, are we getting increasingly quote overbought because one, we’ve entered a new world of financial economics or two, we have a massive new generation of young investors who do not know what overbought truly looks like and means for future investing.”

Jeff: Okay, well, how about all of the above? I could probably spend five hours talking about this. There’s a couple of things that make this particular market environment different than what we’ve seen before. And I’ll preface everything by saying that if you watch any of the business shows, you get analysts on there all the time talking about how we’ve never seen this thing happened before. We’ve never seen this thing happen before.

In April, we were talking about how we’ve never seen a market sell off like that, where so much participation on the downside. And now this big rally back, we’ve never seen a rally come off the bottom like that. There’s a reason why we’re seeing things that we’ve never seen before.

Part of it has to do with the fact that there is a gambling mentality in the market. You have money chasing money chasing money. So you have money chasing action. So stocks that have been hot get hotter, stocks that have been cold get colder until that shifts and inevitably that always shifts. But for the moment the gambling wins out. We saw that in late 2021. was quite obvious when you had all the specs that were doing the crazy things. You the ICOs doing the crazy things. had, what is it? The yacht club monkeys or whatever it was that were going crazy on price action. So when you have a gambling mentality, yeah, momentum wins all the time until it doesn’t. And momentum tends to stop pretty quick.

So gambling tends to be associated more with the younger folks coming into the market. And I won’t belabor that. It’s just the nature. When you’re 20 years old, you’re willing to bet a little bit that you’re not willing to do when you’re 70 years old. So that has something to do with it. It also has to do with the market structures a little bit different now because of zero data expiration options.

Not a lot’s been written about this, not a lot’s been covered on it, but you can find all sorts of articles that talk about some of the things that are happening in the market right now directly as a result of it. When you have, I think I read this week, 68% of all the S&P option contracts are zero day to expiration options, meaning folks who are trading, 68% of those contracts that traded today are going to expire today.

That is pure gambling, right? I mean, we’re not doing a fundamental valuation and saying, yes, the S&P because of this and this and this ought to close at this. We’re just making a bet the S&P is going to close at this level or above or this level or below. We’re going to trade based on that.

If you look at where the S&P has closed every day the past couple of weeks, you’ll find that the SPY has closed at or near the strike price with the largest number of options outstanding, and the largest volume of options traded for that day. That’s also true of the S&P500 index options that are zero day at expiration as well. So there’s these sell side of that, the contra trade, the sellers of those options have a vested interest in making sure that that S&P closes near that strike price. make the most money on that. So it’s not a coincidence.

And it’s usually the folks kind of like if you play poker, it’s the guy with the biggest stack that has the better chance of winning. Well, on Wall Street, it’s the friend with the largest amount of money that has the best chance of winning. And when you have a low volume environment, which is what we have typically during the summer months, a low volume environment and somebody with a big stack, they can push prices around. And when you have two stocks, Nvidia and Microsoft making up a large percentage of the S&P 500 index. 10 % or 10 stocks make up 40 % of the index.

You can push those stocks around and you can target a price. Not saying that you can do that in an efficient market where there’s a lot of action, a lot of activity, but in a low volume environment, you can do that. And I think you’re seeing some of that. And I’m not putting a conspiracy hat on or anything else. This sort of stuff happens often.

Folks with big amounts of money are able to push prices around a little bit. You see it all the time. And I think we are seeing some elements of that. So we’re seeing elements of gambling and we’re seeing elements of, you know, the function of the market has changed a little bit because of zero to eight expiration options. My job is to recognize that that’s what’s happening and to make recommendations accordingly.

So I can’t, you know, even if I’m bearish, I can’t sit here and say, hey, let’s, let’s short a whole bunch of stocks here because right now, the momentum and the guys with the option power and the big stacks are betting on it moving higher. So I can’t do that yet. There will come a time where that bet is shifted and it goes the other way and it’ll make sense to do it. But right now, I go back to how we started this podcast off.

I’m happy to sit with cash on the sidelines. You know, I’m sitting in my money market fund, I’m getting 4%, 4.1%. It’s not fantastic, but I’m risking zero to do that. And my biggest concern with the market is the higher we go, the more those valuations get stretched, the more gambling takes over the thought processes in the market, the more vulnerable we come to a rug pull. And a rug pull happens very quickly. And we’ve seen it before. And I’m always, you know, I’m grandma on the beach telling everybody to wear your sunscreen. But at some point, you’re going to say, you know, I’m glad somebody came up with and said, wear the sunscreen because you’re going to get burned otherwise.

Rachel: It’s a really great image, Jeff. Thank you. But of course, for young people, we have the most access to markets that people have ever had ever just in our pocket with phones, right? Nobody’s out there saying, no, you have to learn how to do this thing. It’s just two clicks. And just, for most people, I’m sure it doesn’t even seem like real money.

And of course, there’s got to be a gambling mentality that goes with that, and until everything comes crashing down and all those young investors learn their lesson.

Jeff: Well, you thought, I mean, you got a glimpse of it in 2021, right? In 2020 and 2021, the government was sending everybody all these stimulus checks and the young people would sit in their parents’ basement and trade stocks and gamble with their COVID relief money. And then we saw what happened in 2022. I don’t want to say we’re headed for something similar, but I think we are.

Rachel: It feels like it.

Jeff: That’s what comes from this type of environment and this type of mentality. Eventually everything comes home to roost.

Rachel: Absolutely. Well, Jeff, I’m going to speak on behalf of probably all of our subscribers and say thank you for telling us to put on the sunscreen and put down the ice cream. And we’ll see what the few months have in store for us. Thank you.

Jeff: Awesome. Thanks everybody for watching.


  •  

Why Jeff’s Looking Over His Shoulder

Dear Reader,

Rachel Bodden, Jeff Clark’s senior managing editor here…

The trial run of our podcast last month was a success – thank you to all who wrote in to tell us that you wanted more.

Today, Jeff tells us his thoughts on the markets, what strategies he’s looking at, and answers some subscriber questions.

And remember, let us know your thoughts, or send us questions at feedback@jeffclarktrader.com.

Check out the video below, or scroll down to read the transcript.


Transcript

Rachel Bodden: Hello everyone. Welcome back to another podcast edition of content with master trader Jeff Clark. Last month when we ran this for our trial podcast, we asked whether or not you liked it and wanted to hear more of it. And the response was overwhelmingly in favor of yes, you do like this style of content, you want to hear more from Jeff and we are happy to oblige you guys.

In fact, the only slightly negative pieces of feedback were that A) I had to speak louder, so I’m happy to do that for you, and B) that people wanted a transcript.

And I’m happy to inform you that every single piece of video content that we publish, we do in fact have a transcript on the website and the Jeff Clark Trader app on the Google Play Store or the App Store.  So if you don’t have the Jeff Clark Trader app, I definitely recommend you download it because that is the fastest and most reliable way to get your content.

So without further ado, let’s just get into it.

So Jeff, I wanted to start with today’s Market Minute talking about the CPC and that ratio of bearish to bullish. And I mean, we are at all-time highs in so many averages and indexes and you are telling traders to look over their shoulders. So tell us a little more about that.

Jeff Clark: Well, I have to tell you, I’m a little bit flabbergasted. I’m happy to admit I’m wrong. I thought when we went through that whole correction in April, and then we bounced off the bottom there, I thought that it was basically an oversold bounce in a bear market. And I thought we’d seen the highs in February. Obviously, I’ve been wrong since we made new all-time highs. And I’m OK with that, because as traders, we adjust. So we take a fresh look at things and try to figure out where we’re going next.

And I’m going to sound like a broken record because I say this all the time or I have over the past couple of weeks, things are stretched. You know, the market is very overbought, very overextended to the upside. We are, I think yesterday, the S &P 500 at 5204 is 100 points above its nine-day exponential moving average. It’s 400 points above its 50-day exponential moving average. To put those figures in context, usually if you get 30 points above the nine-day EMA, you’re considered overbought.

So we’re 100 points. If you get 200 points above the 50-day moving average, you’re overbought. We’re 200. We’re 400 points. So we’re basically double to triple as overbought as would be normal overbought conditions. But this goes to a bigger concept in that in this particular type of market, as things go back and forth and they get stretched and as indicators get stretched, what we’ve done as investors and as traders is we’ve evolved. We need more of a stretch to justify a movement in the opposite direction. What I mean by that is where it used to be a 30 point move above the exponential, nine-day exponential moving average was enough to get us to look for a snap back.

We can’t do that anymore because 100-point moves are becoming commonplace or 400 points away from the 50-day moving average. And just think about where it was in April, where the market just, I don’t want to say collapsed, but it cascaded all the way down and we were, think 700 points below the 50-day moving average. That rubber band just got super, super stretched. All we’ve done now is reverse it. So now we’re overbought on the upside.

Valuations are expensive. You know, the S&P 500 is trading what 23, 24 times forward earnings. That’s expensive no matter what market conditions are, no matter what economic conditions are. We rarely see valuations that are that stretched. So you’ve got that fundamental problem. Technically, there’s all sorts of warning signs out there, but they’ve been out there since we hit 5,800. So, you know, we’ve managed to add on

300, 400 points almost to the S &P 500 since being overbought from a technical perspective. So all we’ve done is stretch that rubber band further, further out. I don’t want to come across as a permabear. don’t ever want to be perma anything. I’m not permabull, not permabear. But it’s usually a poor idea to be buying stocks when you have extremely rich valuations and extremely stretched technicals. There has to be one of two things has to happen.

Either the market needs to just sort of mark time for a while and allow all the other indicators to play catch up. The moving averages can come together to something a little bit more reasonable where the put call ratio can come back to a more reasonable figure. To where all these other indicators that are flashing caution signs can come back to neutral. That would be the most bullish of situations where we just sort of mark time for a couple of weeks and allow everything to catch up.

The bearish side of that is we get a real quick three to five to seven percent drawdown and you know, some of the bullish enthusiasm out of the way. That is my preference. I’d rather see a more significant type of a drawdown to allow us to take a look at the new parameters of the market. What I mean by that is, you know, clearly my thesis of this being a bear market bounce has been ruled out.

So now what I want to try to figure out is this a sustainable move higher that’s going to lead to even higher prices as we go through the year or is this going to be or is it a bluff you know is it really this what I thought was the start of a bear market in April maybe it’s July that brings us into a bear market and I’m not predicting one way or the other what I’m saying is I want to see how the market behaves in a correction phase to determine where we might be headed from there that doesn’t mean there are stocks to buy there’s plenty of stocks to buy we had a couple trades we made yesterday that worked out really well, even though the market is floundering just a little bit today. your, that was a very long-winded to your question, answer to your question about the CPC indicator.

Basically, everybody was running to buy calls last week. CPC is the put/call ratio. Anytime it gets down below 0.8, it means people are buying a lot more calls than they are puts. Anytime it’s above 1.2, they’re buying a lot more puts than they are calls. And so, it’s a contrary indicator.

So really, what I talked about in Market Minute this morning, is just basically anytime you get into this situation where the CPC is down below 0.8, you typically get a two- or three-day pullback.

Rachel: So what do you recommend your readers do right now? Do you recommend they just kind of sit in cash? What do you recommend they do?

Jeff: Well, since we crossed 5,800, I’ve been very, very conservative. I’ve been suggesting sidelines, cash, all that sort of stuff. And what’s happened is a lot of the stocks that have been moving higher, they’re the tech names that were moving higher in January and February. But there’s still a lot of stocks that haven’t participated in that. You have about half the S &P 500 that’s still trading well below its 200-day moving average. So you still have some opportunities.

What I think is going to happen if we continue to move in a bullish pattern throughout the rest of the year is a lot of these beaten down value-oriented stocks are going to have to start playing catch up. So you’re going to see things like Constellation Brands that we talked about yesterday or some of the healthcare stocks that we traded in Delta Report start to play catch up. They’re going to act a little bit more bullish. What happened yesterday also was the last day of the quarter. So money managers and portfolio managers have to basically show what they own at the end of the quarter.

So everybody was rushing to buy the top performing names. Everybody wanted to buy Oracle. They wanted to buy Nvidia. wanted to buy, I don’t know, just throw any other names out there. Broadcom, all the stocks that have done really, really well, and they didn’t want to own any of the stocks that haven’t done well.

Well, like the healthcare stocks that we just talked about, like some of the energy stocks. So I think what’s going to happen as we get into this third quarter is you’re going to start to see some rotation out of some of the higher performing names into some of the lagging stocks. That would be the most bullish of circumstances.

So I am trying to focus on that. I’m focusing on finding those value-oriented bargain stocks that are showing technical bottoming patterns. And a lot of that is in the healthcare sector. And when we talk about buying healthcare stocks, they can’t believe I’m recommending healthcare stocks, but they’re the cheapest in the group and they look like they’re bottoming.

And you look at something like Constellation Brands, which has been a horrible performer for the two quarters of the year so far. But it’s one of the strongest stocks in the market today. So that helps prove my thesis that I think a lot of the laggers are going to play catch up. So if you want to put money to work, look at buying into the lagging stocks for last quarter. I wouldn’t chase any of the high-flyers. I can’t buy a Palantir at 160 times revenue. just, it doesn’t make any sense to me. Yeah, maybe it goes even higher from here, but it’s just, you typically don’t do well buying the most expensive stocks.

Rachel: I just read that we wrapped up the best quarter since December 2023 and, you know, living through it, it hasn’t felt like the best quarter, but I guess that’s what the statistics say.

Jeff: Well, have, mean, the statistics, there’s a lot of stuff that hasn’t happened in decades. You know, that whole decline in April we hadn’t seen since what, 1924, I think somebody was telling me. A lot of the things that are happening now with a lot of the indicators that I follow, I’ve never seen before. You know, we’re hitting extremes that haven’t registered before. We’re getting false signals on indicators that I haven’t seen occur very often. I talked about last week, we talked about the summation indexes for the New York Stock Exchange and the Nasdaq.

Rachel: I know.

Jeff: They had a sell signal in mid-May. That was negated. Then they had a secondary sell signal, what I call a double sell signal, in the middle of June. And that was just negated. It’s never happened, or at least not in my lifetime when I’ve been following these signals, where we’ve had two back-to-back sell signals for the summation indexes. Both of them failed. So I’m imagining when we get the third one, third time’s the charm, and maybe it’s going to be a bit bigger, but yeah, we’ll see.

Rachel: And just really quickly, Jeff is talking about the summation indexes that he spoke about in his monthly live Alliance call for his Jeff Clark Alliance subscribers. And he does it once a month and it is the best thing that I’ve seen. We have hundreds of subscribers join us to hear what Jeff has to say for the rest of the month.

Jeff: It’s, you know, the fun part about that though is because we do it every single month, you can tell if I was right or if I was wrong. can tell if I get bragging rights or if I’ve got to look at it go, okay, I missed this particular call. So, know, I address a lot of these things in Market Minute as well, but being able to access the live calls are kind of a fun little benefit.

Rachel: And if you’re a Jeff Clark Alliance subscriber, let us know if you like those. You know, it helps us to know what you like, what you don’t like, what you want to hear more of. And just before we get into our subscriber questions, we don’t have any questions to answer if you don’t write them in.

So please keep writing to us, keep asking questions at feedback@jeffclarktrader.com. And since we’re going to keep doing these podcasts, we will address them in a future call.

Do you want to get into some of those questions, Jeff?

Jeff: Sure, sure, I’m done talking.

Rachel: Alright, this is a question from Raymond. Jeff, for those that like to trade weekly to bi-weekly and not risk the more expensive trades, could you discuss put credit spreads?

Jeff: Okay, I’m going to assume this is in regards to selling uncovered puts, probably in Jeff Clark Trader. The strategy is to generate income by selling uncovered puts. And we do that in a lot of the services, Jeff Clark Trader, we call it a bill payer strategy where we’re collecting income for doing that.

The two of the three recommendations I’ve made so far in that service have been stocks that are above 100 bucks a share. Some people are uncomfortable selling uncovered puts on stocks that are above $100 a share because it commits them to buying 100 shares of stock. So 100 shares of $100 stock is a $10,000 commitment. People are, know, sometimes the accounts aren’t large enough to do that. So what you can do alternatively is you can do what’s called a credit spread. What that means, all it means, spreads are what we call BS, where you buy something and you sell something.

In a credit spread, the main position is the sell of it. So you’re selling an uncovered put option, and then what you’re doing is you’re buying a lower strike price put option, which essentially covers it. So for example, the trade that we just wrapped up in Jeff Clark Trader was Constellation Brands. So we sold an uncovered put option at $155. So if you were to sell that undercover put, you’re committing yourself to buying the stock at $155.

So that’s a $15,500 purchase commitment. If you didn’t like that idea, what you can do is sell the $155 put, I think we got two bucks for it, and then the $150 put, you could buy that, so you’re covered. So basically you’ve sold the $155 put, collected two bucks, and the $150 put, when I checked out the prices yesterday, you could have purchased that for about a buck. So essentially what you’re doing is you are obligating yourself to buy the stock at $155, and then having the right to sell it at $150.

So your maximum risk is, or your maximum spread is those five points. So instead of having a $15,500 commitment, you have a $500 commitment. Instead of collecting 200 bucks in income, you collected 200 and then you spent 100 to cover yourself, so you collect $100 in income. So your profit potential on one contract is less because you’ve lowered the spread, but instead of a $15,500 commitment, you only have a $500 commitment.

If you take it a step further, one of the things you can do, let’s say you normally trade 100 shares at a time. You sell the uncovered put at 155, and then you think, well, I need to limit my downside a little bit, so I want to buy that other put. Well, sell two puts, sell two puts at 155, and then buy two of the 150 puts, and that way you’re collecting, you’ll still collect the 200 bucks.

I’m talking over myself here and I know it might get little bit scrambled, but essentially you’ve got two options that you sold for two bucks, you collected 400, and then you buy two options for one buck each, you spend 200 bucks. So you still collect your 200 bucks, you just have a $1,000 commitment now instead of $15,500. I hope that was accurate. If you’re confused on it, next time we get together, I’ll work it out on a spreadsheet and show it to you.

Rachel: Let us know if you want to hear more about credit spreads, because that seems like good option for people.

Jeff: But credit spreads, not to talk over you, but credit spreads are definitely, if you have a small account size and you’re looking at selling uncovered puts on stocks that are maybe outside of your comfort level, it’s a very, very good way of reducing your risk and reducing your commitment to that. The one thing I will say, though, is it works best on the weekly options. If you do it on a monthly basis, the problem with that is

If you’re right on the stock right away, if you’re right on the direction, you sell an uncovered put, the stock goes up, the uncovered put loses value. But the put that you also purchased loses value. So it doesn’t matter that much if you have an option that expires in three or four days, you just run it out and they both expire worthless and you make the maximum profit. But if you have a month to go, it’s possible you’re right on the stock right away, the stock moves up, and then over the next 25, 24, or 23 days, the stock comes back down and now you have what used to be a profitable situation turns into a losing situation because you’ve committed for too long. So spreads tend to work best on short-term options and when I say short-term I mean the weeklies.

Rachel: I think that would be a really cool thing to cover maybe in our next podcast.

Jeff: I think that is just the biggest, most worthwhile comment for today.

Rachel: Good. Next question comes from Gary. What do you expect long-term treasuries to do in the next two months considering the world and the economic situation?

Jeff: Okay, see that the Treasury market I think we’re in a very complicated place or a very I Can’t even think of the word for it, but it’s not good the US Treasury we have a $37 trillion deficit in the United States $9 trillion of that comes due in the next several months So that has to be rolled over it has to be refinanced typically what they do is they issue new bonds pay off the old bonds

The problem is, is a lot of those old bonds were issued at much lower interest rates. We now have on the 30-year treasury, we have in the 10-year treasury, we have the highest interest rates we’ve had in 18, 19, 20 years. So we’re refinancing at a higher rate. I’m certain the fed would love to have a situation where they can do it, or the treasury would love to have a situation where they could refinance these bonds at lower rates. I just don’t see how that’s going to happen. And so if I’m a treasury bond trader, I’m fading any rallies in the treasury bond market. We’ve had a good one week rally, I think, in TLT, which is the exchange rate of fund for 20-year treasury bonds. Pretty good rally with that. But I think that’s something I would fade. I would look to sell and to shrink on that. So if you look at resistance lines on TLT or I don’t want to get too complicated here, but somewhere around 89, 90 bucks a share on TLT looks to me like a good place where I would take a short position.

If I was inclined to do that. I think the treasury bond market is going to have some difficulty because we’ve got to borrow a lot of money and this one Big Beautiful Bill they keep trying to pass through is going to require borrowing a lot more. So the more money we borrow, the more is required for foreign investors to step up. And right now, another problem is you see the dollar just getting trashed. The dollar’s fallen out of bed the past couple of months.

So foreign investors, you know, they’re getting a double whammy. The bond prices are falling and the dollar is falling against their currencies. So that’s not an attractive situation for most foreign investors to step up and buy treasury bonds. So I think that if the market is going to have a shakeout move, it’s almost always inspired by poor action in the treasury market. And I think that’s where the biggest risk the stock market exists at the moment.

I know that doesn’t sound exciting.

Rachel: No, it’s a huge deal, clearly. And I just am so interested to see how it all shakes out because, like you said, there’s a lot of things that you’ve never seen before. So means I definitely have never seen them before.

Jeff: No, the fascinating part is when you go back to like last September when the Fed first lowered interest rates, everybody was talking about, we need lower interest rates, we need lower interest So the Fed says, okay, fine, we’re going to lower interest rates half a percent, 50 basis points. And I said at the time before it happened, I said, when the Fed does that, the odds are pretty high that the long-term rates will actually go up because of the way that that works. And that’s exactly what happened. So now you have all this pressure on Mr. Too-Late Powell to lower interest rates.

And I’m saying he’s a little bit handcuffed because if he lowers the short-term rates, he’s going to push long-term rates higher at a time where they need to refinance $9 trillion in refundable bonds. That’s a difficult situation to be in. I don’t envy him.

Rachel: Me either. Let’s hit our last question for today. And it might actually be a longer question to answer than I kind of initially thought. So…

How does Jeff Clark determine risk versus reward for a given trade? This is from subscriber Bruce.

Jeff: Okay, that’s not that hard to understand. When I buy an option, I’m putting up, let’s say I pay a dollar for an option. I’m willing to risk 100 % of that because my risk parameters, I look at a situation where I think the stock might do something. So rather than risking money in the stock, I’m going to take a very small amount of the money that I would risk in the stock and trade an option with it.

So I’m willing to risk 100 % in any option that I purchase. But in order to put the risk reward on my side, I also in that situation need to be able to make at least 100 % on that option. So if I’ve a stock at 20 bucks a share and I think it could go to 25, the most I would pay for an option with a strike price of 20 would be like two and a half bucks because I can put up two and a half. If I’m right here, it goes to 25. That call option would be worth five. So I’ve doubled my money. That would be the minimum that I would expect in a risk/reward situation.

If I have to pay more than two and a half, or if I don’t think the stock can go past 23 or 24, I don’t take the trade because I’m not being rewarded commensurate with the risk that I’m taking. Ideally, I like to be able to make twice as much as what I’m risking. So would buy an option for two, thinking that at some point I might be able to sell it for six. So I could make four bucks while I’m risking two.

Obviously, the higher the potential reward, the better the setup for that. There’s situations where I’ve gone and I’ve bought 10 cent options because I thought, gosh, if at the end of the day, if the market does this, this thing could be trading for a buck. And so I’m willing to take a little bit of money and risk it on that, but that’s where probability now enters the fray because now you have to look at what is the probability that a stock will do what you think it’s going to do over the time frame you hold that option.

So there’s a handful of factors that come into that, but really the bottom line is, when I look at a stock situation, I project where I think the stock could move. And oftentimes it’s usually back to the 50-day moving average. If we’re stretched way below, I’m looking for a move back up, if we’re stretched way above, I’m looking for a move lower. I want to know that I can make enough on the option to at least double my money because I’m willing to risk 100%.

Rachel: Okay, so the way that you find those is by looking at the 50-day moving average and saying, I think it’s going to go back up or meet it back down. That’s sort of where you go.

Jeff: Well, yeah, I look at a stock and I try to figure out where I think the stock is going to go. And if I can make reasonable estimates where that stock is going to go, then I go to the option market and I see what they’re priced like. A good example is one that I didn’t take. know, Bitcoin, I talked to Barish about Bitcoin a couple of weeks ago. I think it was trading around $108,000 a point. It’s still about $107,000 or $108,000. But I looked at BITO. I think it was trading around $21 something.

And I was thinking about buying put options or recommending put options on BITO. And when I looked at the chart of BITO, I thought, okay, the best-case scenario for a downside move, maybe the stock gets to 18. So I was looking for August puts that would allow me to be profitable on move down to 18. The stock was trading around 21. The 21 puts were priced at three or 270, something like that. I couldn’t make that recommendation because my target price on BITO was 18.

So if we buy the puts with the strike price of 21 and we actually get to 18 and it takes a little while to do that, then those puts are going to be worth about three. The intrinsic value is three. I’m not going to pay 270 for a put option that I think if it hits my target is going to get to three. That’s a very poor risk reward situation because I’m risking $2.70 to make 30 cents. That’s a poor risk reward situation.

I would take the opposite if I had to pay 30 cents for it thinking it could be three, that would be wonderful. But that didn’t exist.

Rachel: Makes sense. And if you are a Delta Report subscriber or a Jeff Clark Alliance subscriber and wondering where to kind of start your search for stocks that fit those parameters, we have a new widget through TradeSmith that every single day puts out the top five bullish and top five bearish stocks. And it’s a really good place for you to start your research. So maybe in one of these podcasts we’ll go through that widget and see how you would trade those. What do you think?

Jeff: Yeah, I think that’s actually a really good idea. Let’s do that on the next one.

Rachel: Sounds great. Well, that’s all we have time for today. I hope that you enjoyed our second official podcast with Jeff Clark. And again, let us know if you enjoyed it. If you have any questions that you want answered, write in, tell us, and we’ll see you next month.

Jeff: Thanks everyone.


  •  

Volatile Markets Are How We Get Rich

Dear Reader,

Rachel Bodden, Jeff Clark’s senior managing editor here…

Today we’re doing a trial run of a new style of content for you – and you’ll have to let us know if this is something you’d like to see more of in the future at feedback@jeffclarktrader.com.

I’ll ask Jeff some questions about the markets, what strategies he thinks are best, where he thinks things are headed, and then we’ll answer some subscriber questions.

Check it out below or scroll down to read the transcript.


Transcript

Rachel Bodden, senior managing editor: Hi, my name is Rachel Bodden, and I’m sitting down today with Master Trader Jeff Clark for a trial run of what could become a regular podcast-style session.

So if you enjoy today’s talk, remember to let us know at feedback@jeffclarktrader.com.  

But for anyone who’s new to Jeff and his work, I can give a brief introduction about him. Jeff’s been trading since he was 19 years old, meaning he’s got more than 4 decades’ experience trading the markets. His signature trading style thrives on market conditions where most investors are just running scared for the hills and honestly, losing money left, right, and center.

Times like the Great Recession when he gave his subscribers 26 doubles or the COVID crash or the 2022 tech wreck and most recently, this style and his strategies led to an incredible win streak since the April 2nd “Liberation Day” flash crash.

Jeff has 3 services in which he sends out trades to his subscribers. In Jeff Clark Trader, 4 out of his last 5 trades were winners, and that’s an 80% win-rate. In Delta Report, he’s gone 5 for 5, but most impressive is Delta Direct, his live trading blog where he posts in real time his thoughts on the markets and posts quick hit trades.

Out of his last 14 trades, 12 were winners. That’s an 86% win-rate in the last 4 months. It’s really something.

So Jeff, I remember us chatting around inauguration day about the impending period of extreme volatility, and you are really looking forward to it. Can you tell us a little bit about why?

Jeff Clark: Well, yeah, I mean, listening to that intro, it sounds like I enjoy chaos, which I actually do. I like volatile markets.

I am not comfortable when things just simply go in one direction all the time. And when you have a long-term bull market like we saw in 2024, where stocks just went up steadily, it doesn’t really fit my trading style.

I like things to go up and down and move back and forth and do all sorts of weird things.

And I thrive on that sort of situation. And that’s why, you know, when you mention You know, the, the great financial crisis, we, we had a really good track record. 2008 was probably one of my best years. 2020 was a very good year, 2022 was a very good year. And since Liberation Day, it’s been fun as well.

Like I said, the volatility and the chaos tends to lend itself to my particular style of trading. And I enjoy having President Trump in office because he tends to make things a little bit more exciting, a little bit more volatile. And, chaos might as well be his middle name.

There’s a lot of stuff going on, and I think we’re gonna, we’re gonna see a lot of volatility over the next several years. And so I think folks who are, you know, the old school style of trading or or style of investing, which is buy and hold, you know, you buy something today and you hang on to it for 10 or 15 or 20 years.

I don’t think that’s gonna work so much for the next few years. I think you, you have to be willing to go in and, and get out quickly. And move around a little bit, and you’ll have the opportunity to do that as we’ve seen over the last couple of months. And I know that markets are kind of back within spitting distance of their all-time highs, right? But most people don’t sit through that.

Like they get scared and they trade out of it and they lose money, and then they buy back in when they really shouldn’t. Yeah, it’s, it’s, that’s the difficult thing in the market is, is even the professionals do this, you know, when prices are cascading and, and things are, are just selling off day after day after day, people wig out, they, they get a little bit nervous and it’s

To stop that pain, they sell and they do the exact opposite of what they ought to be doing, you know, when we look at, you, you, again, going back to 2008, the great financial crisis, the best time in our generation to buy stocks was in 2008. Most people were selling in 2008. You know, we talked about my track record, we had what, 25, 26 doubles. But those were, most of them were on the buy side.

We were buying, at relatively cheap prices. And during, you know, periods of extreme volatility to the downside. And again, just even a couple of months ago with Liberation Day, we had that same opportunity and most people were selling.

Now, we were kind of anxious about the market in January and February as we’re going into this year, looked to me like prices were stretched a little bit. Valuations were certainly stretched, you know, the S&P 500 was traded at 23, 24 times forward earnings.

That’s expensive, no matter the conditions. Then you throw the trade war on top of it and, and people get nervous. So we were kind of expecting a little bit of a downdraft, and we took advantage of that downdraft by actually buying into stocks around early April. And then we’ve subsequently sold many of those positions. Now we’re back up within spitting distance of the highs again, and now I’m starting to look at the valuations.

So we’re here, here we go again. We’re 23, 24 times forward earnings. Stocks feel expensive, most people who were selling in early April recognize they made a mistake, and now they’re chasing those positions back now, and they’ve bought into it.

What worries me the most about this is when you look at typical bear markets. They tend to unfold in 3 distinct down waves. So you get that first move lower, then you get a rebound, then you get another move lower, then a rebound, then a final move lower.

It’s that second move lower that tends to do the most damage, because what happens is people sell out in that first move, then the market bounces all the way back up to within spitting distance of all-time high, and people go, Oh, I got bluffed out. So this time, they buy in and they go, no matter what, I’m not selling.

So it takes the market causing even more pain on another drop lower to force those people out of the market again. And undoubtedly, that’s what happens. And if you go back to, you don’t have to go back that far. Go back to 2022, you know, the market peaked in January of 2022. We got the sharp downdraft into March, April, huge rebound, almost back to all-time highs, and then a much deeper decline going into October.

I hate to say it, but I’m kind of expecting something like that this time around. I may, may not get it. Maybe I’m wrong, and maybe the market just goes right off to all-time highs again. It would, it would shock me if that actually happens simply because valuations are so stretched.

But if it does start to roll over from here, I think a lot of folks who just recently bought back into the market are gonna hold on a little tighter this time, which means it’s going to take the market moving even lower, below what we saw in early April, which was 4800 on the S&P.

5000 was the closing low, but intraday, it dipped as low as 4800. Going down below that level, it’s going to be painful for a lot of folks. So I would advise folks, if you were in the market in April, and you were wishing you had gotten out in February… Now you have a chance to get out.

You’re selling near the all-time highs, near expensive valuations, you could do a lot worse.

And given what I think is coming, I think it’s probably a reasonable time to start raising some cash. You don’t have to bet on the downside, you know, a lot of folks shorting stocks is maybe not in their wheelhouse.

I tend to like to do it, but I just like to have cash available, so when that market comes down again, I have an opportunity once again to put that money to work at lower levels. Most of the money that you make in a bear market is on those huge rip your face off rallies that come off of deeply oversold conditions. And that’s what we’ve seen.

We’ve seen that since April, and in every bear market, you look at the top 10 rallies ever in the, in the history of the market, every single one of them happened during the bear market.

Rachel: And you are really good at capturing these. Don’t get mad at me, I have a quote from Porter Stansberry about your performance in 2008.

He was writing about, your Short Report track record back in 2009. So this was your trading record in 2008, and he said:

Jeff’s trading record this year in the short report was nothing short of heroic. He made 52 recommendations, all of them short-term trades. Out of these, 42 made money. A win rate of more than 80% in options trading is ridiculous.

The average return of every trade was a bit more than 31%. That’s outrageous when you understand the short duration of these trades and the turnover in the portfolio. How outrageous? The cumulative total return was greater than 1,700%.

Jeff: Well, yeah, like I said, 2008 was a pretty good year, and, and I think we’ll have a similar opportunity this year.

2008 was a generational buying opportunity. They created a generational buying. I think we’re gonna have another one of those. Yeah, I, I do. I, I’m looking forward to it.

I don’t know if it comes in 2008 or it comes in, or I keep saying 2008, 2025. I keep going back to the good old days, 2025 or 2026. Either way, I want to be available for it.

And, again, my style of trading is I wait for things to get really extremely stretched, and then you just go in and, and start buying.

Right now we’re stretched the opposite way. Right now, we’re stretched a little bit too far to the upside, I think. So that rubber band has to snap back a little bit.

And if we do get that second wave in a bear market, that I’m sort of anticipating, we’ll have the opportunity to put money to work at significantly lower levels, significantly better prices. And so I just advise folks to be patient on that.

When you pay attention to the market every day and you’ve got a pile of cash, you’re just sitting here waiting to deploy, it can be frustrating sometimes waiting for prices to come down, especially as prices just keep seem to levitate. You just have to be wise about it and know that markets don’t move in one direction.

They will almost always give you an opportunity to buy. You just have to be able to to Avoid the FOMO trays, right? The fear of missing out. That probably causes more damage than anything else other than leverage. Leveraging and fear of missing out will destroy a portfolio.

So if you can be patient and you can operate on just, you know, it’s your money. Put it to work at the right time, you’ll probably have an opportunity to do very, very well.

I often say, everybody makes money in a bull market, but it’s the decisions you make in a bear market that can make you rich.

I think folks will have an opportunity to get rich this year. It’s really about harnessing all of those emotions.

Rachel: I think it was Men in Black that said, “humans are dangerous, panicky animals.”

Jeff: Leave it to Men in Black quotes to work their way into a stock market podcast.

Rachel: What would you say the best strategy that a person should know about in this kind of market?

Jeff: Well, I mean, not to be immodest, but a reversion-to-the-mean strategy is what works best in this. And all the reversion-to-the-mean strategy is, it’s that rubber band philosophy.

It’s that proverbial market rubber band stretches and stretches and stretches so far in one direction that inevitably it has to snap back. You just wait until the odds overwhelmingly favor a snapback.

And you say, well, what is that?

Well, if you’re looking at buying stocks, You look to buy stocks when they’re trading near the low of their historical fundamental values. So if you’ve got a stock that normally trades 15 times earnings, and right now it’s at 18 times earnings, that’s expensive. Probably not willing to buy it at these levels. It comes back to 15 times earnings, that’s normal. OK, that’s like going into a store and buying your sweater at an average price.

But if you can get it down to 12 times earnings, if you can pick up a stock that normally trades at 15, You’re getting it at 12, that’s a 20% discount. That seems pretty good. If you can get a 40% discount, that’s fantastic. So that’s what I’m talking about when I, when I talk about that rubber band stretching. If you can stretch into deep oversold conditions where you’re buying stocks at fractions of what they would normally trading for, That’s a good opportunity.

And then you get that snapback rally brings it all the way back up to neutral and maybe expensive again, and then you unload the stock. And you don’t have to wait 5 years or 10 years to make those sorts of returns. You can see enormous returns in a matter of days. Think about it. Back in April, you had Marvell Technologies trading at $50 a share.

It’s trading almost $70 just two months later. That’s a 40% return. In 2 months. The stock doesn’t move 40% in 2 years. So you’ve captured 2 years’ worth of returns in just 2 months.

That seems to me to be a pretty good time to be buying stocks in that situation. Now we have the opposite condition though. We have stocks that have stretched too far to the upside. You’ve got stocks that are trading 1520, 30 times revenue. Never mind earnings times revenue.

That just seems expensive to me. And yeah, they could stretch further. That rubber band can keep going a little bit, but ultimately, they always snap back. So I, I’ve not I’ve not experienced the Condition where it hasn’t snapped back. So I trust that it will.

It’s just a matter of having the patience to wait for that to happen.

Rachel: One of the strategies we’ve been doing recently is the bill payer strategy or the method of selling uncovered boats. And can you tell us a little bit about why that was such a good strategy or is a good strategy for right now?

Jeff: Well, the idea of selling uncovered puts means you are going to obligate yourself to buy a stock at a certain price, and for doing that, you collect income by selling the uncovered put. It’s a wonderful strategy used to generate income, and it’s an absolutely fantastic strategy in a volatile market where option prices are expensive.

We explain a little bit about that. When you look at the VIX, the volatility index, and that’s sort of the easiest way to measure option prices. VIX normally trades right around 15%, or it has been over the past several years. It’s been right around 15%. Anytime it’s below 15 is probably a poor time to be a seller of options because you’re not getting paid that much to do it.

So oftentimes when the VIX is low, it’s probably better to be a buyer of options, right? You buy cheap things, you don’t sell cheap things. When the VIX is high. It’s expensive, it it’s. Probably not so good to be a buyer of options.

It’s better to be a seller. So recently, with all the volatility in the market, the VIX has been averaging somewhere around 20. It’s a little bit lower than that right now, but it’s been averaging about 20. That’s expensive. It’s about 33% more expensive than normal.

That means option prices are expensive. If you’re buying options in an expensive premium environment. The odds are against you making money. And the reason I say that is, when you buy an option, you have to be right in a couple of ways. You have to be right on the direction of the stock.

You have to be right on the timing of the stock, and you have to be right on the, the magnitude of the move, meaning you’re paying premium for the right to buy a stock at whatever price you’ve agreed to. Stock has to move up, and then it has to move up enough to recover your premium before you can even start making a profit. So it’s possible to be right on the timing and on the movement and still lose money when you’re buying an option because you haven’t captured enough of the premium. You haven’t, it hasn’t moved enough for that. When you are selling an option.

All of those things work in your favor. You can, if you sell an uncovered put. As opposed to buying a call option. They both make money as the stock moves up. But when you sell an uncovered foot, you make money when the stock moves up, you make money when the stock stays the same, and you make money even if the stock falls a little bit, as long as it doesn’t fall below your break even point on the put sale.

So the more money you can get for selling an uncovered put, the more room you have before that break even point gets violated. So you can be wrong even more than that. So when you have a, when you have a sell-off in the broad stock market using Marvel technology is a good example, the stock went from I think $120 a share down to $50. Marvel at 50 was trading 16 times earnings. Marvel normally trades about 30 times earnings, about twice that.

Even at 16, you go, well, that’s not that cheap. Well, it is for Marvell. It’s historically it’s cheap. So, I don’t mind buying Marvell at 50. I like even better the idea of selling to somebody else.

An uncovered put where I’m obligating myself to buy the stock at $50 you’ll pay me for that. And we did this in, Delta Report, where we got paid something like $400 to obligate ourselves to buy 100 shares of Marvell at 50. That’s a healthy premium for that. And then a couple of days later, the stock moved. The option basically went down to almost nothing.

We bought it back, closed the position, had a nice little profit. The point of it though, is by selling the uncovered put, we’re not only obligating ourselves to buy a stock we want to own at a cheap price, fundamentally, and even the technical picture looked good, but we’re getting paid to do it. It’s like going into Nordstrom’s and saying, God, I love that sweater. Sweater used to be 100 bucks. Now it’s $50.

You go over to the cashier, you say, here, hold this for me. If it ever gets to $40 give me a call, I’ll buy it. Not only that, the cashier opens up the, the register and hands you 20 bucks, and then you walk away. So you just got paid to agree to buy something that you want to own at a price cheaper than what it’s going for right now. Nothing wrong with that.

Rachel: I’ve been working with you for a while now, and that’s the best, metaphor for it that I’ve heard. I can really grasp that. That’s that’s really good.

Jeff: It’s going to sound sexist, but you’re female, if I put it in shopping terms, maybe it makes sense. I know that’s the easiest way I can explain it to my wife.

Rachel: Your wife is a smart lady. Well, talking about put options is a great segue into a few questions we received, and I figured we could go through a couple of them.

All right, so our first question, about selling uncovered put options and even though we can’t give individual investment advice, I’ll go through a little scenario for the subscriber. We recently recommended selling an uncovered put option and even though it eventually closed for profit.

This subscriber lost on the trade because he got spooked and sold out. And I think it was for Humana, and the subscriber asked, is this strategy only for people with bigger capital in their accounts because it would have been $22,500 to be put the position.

Jeff: Well, the Humana trade that he’s talking about was a one-day trade. We sold an uncovered put on Thursday, and we sold it Friday. The stock was starting around $230.

So we sold the $225 put that expired the very next day, and we got, I think, $2 for it. So we’re breaking even at $223. Anything above $223, we make money on this trade. The stock intraday traded down to $225. That subscriber, if he closed his position, then he bought the put back, probably took a small loss on that.

Had he held it to the next day, like we did in the service, it expired worthless, that 200 bucks was yours to keep.

You only sell – this is the most important thing – you only sell uncovered puts on stocks that you want to own and at the prices you’re willing to pay. If you don’t like the idea of owning Humana, which was trading at 13 times earnings, cheap relative to its history, it had a bottoming pattern in place.

Everything looked really good, and we were only looking at a one-day hold on it. If you don’t like the idea of owning Humana at $225 a share, you don’t sell that uncovered put.

You say thanks for the idea, but I can’t take that recommendation and move on to something else. If it’s too large of a position. Each option covers 100 shares. So you’re committing ultimately to to buy 100 shares of Humana at $225 a share. That’s $22,500.

If you don’t have the capital to do that, you don’t do that trade because you might wind up doing exactly what the subscriber did, wigging out a little bit, spooking out of the trade, and suffering a loss. You don’t want to ever be in a position to where the emotion behind that trade is too large.

This happens when you sell one contract on a stock that’s too expensive, or you sell 10 or 15 or 20 contracts, and it’s your entire account moving along with that stock.

That’s also a very common mistake is that people overleverage their trades. If you can avoid doing that, avoid making those mistakes, you can react unemotionally in positions. I was okay if the stock fell to 225, 224, 223, whatever. Humana was a cheap stock to me. I

I mean, it was fundamentally inexpensive, and I wouldn’t mind owning it at $225. So it didn’t matter to me if the stock moved down below $225. It just so happened it didn’t. It came on back and the option expired worthless, and we had a nice little profit off of it. But had it moved lower, that would have been OK too.

I don’t mind buying the stock then. So it’s not that the strategy isn’t appropriate for smaller accounts. I would say that you ought to have at least $10,000 in your account if you’re going to use this strategy, , just because the nature of it requires that you be able to buy 100 shares of a stock, and I can’t imagine, you know, doing that on less than a $10,000 value account. But, you know, if all you have in the world is $2000 you’re not doing the strategy.

And if being put $22,500 worth of stock is not good for your account, then you should not take the trade. We have weekly option recommendations all the time. So you miss one, it’s not a big deal.

We got one coming next week. There’s that control the FOMO. Exactly. It’s not a matter. Don’t ever fear missing out.

That is an emotional reaction and emotions when you’re trading stocks and options generally a bad thing. Actually, we covered a lot of the questions that came in about really good.

Rachel: OK, here’s one. I’ve gone over the training videos to the point where I almost have them memorized, and I still don’t understand the term “buy to close.” What is the purpose when you sell an uncovered put?

Doesn’t the trade automatically close on the expiration date?

Jeff: OK. Buy to close simply means if you sell an uncovered put option, you are selling to open that position. So you’re starting the position by selling the option. So to close the position, you have to buy it back.

That’s all buy to close means. So you’re going to close the position by buying the option back. So if you sell an option for 2, And now it’s at 10 cents, and you want to close it, you buy it back to close, 10 cents, that’s it. If you sell a put option and you let it go ahead and expire worthless, you don’t ever have to buy it back to close. It just expires worthless, and the brokerage firm, the day after it expires, removes it from your account like it doesn’t exist anymore, cause it doesn’t exist, it expire.

So, if you let it expire, then you don’t necessarily have to ever buy it back to close. Where it makes sense to buy back a put option is when you’re looking at the risk reward situation. For example, if you have an option that has maybe a month or 2 months or 3 months left of time, and it’s down to 10 cents. Why risk that the possibility of the stock might move in the opposite direction and you might wind up with a liability on the trade?

Just go ahead and close it out. And then if it does move the opposite direction, maybe you have an opportunity to sell another uncovered foot against that stock. So that’s the only time I would say it makes sense to buy back early, or if the company has an earnings announcement coming out, and you want to just get out of the position, take your profit and move out. That’s OK too. So, buy to close just closes a position that you sold to open, but you don’t have to do it, you can just let it go ahead and expire worthless.

All it does is when you’re, when you’re looking at the risk reward situation, if the option’s trading for 10 cents and it’s got 2 months left. Pay the 10 cents, buy the option back, close the position, move on with your life, rather than leaving the position open for another 2 months, and the most you can make off of it is another 10 cents.

Rachel: Might just be a situation where the language is kind of weird as well if you’re new to options trading, but I think that was really good explanation.

All right, so we’ve been talking about uncovered puts and you put out this really put out this really great video in Jeff Clark Trader on May 19th about how to do the strategy, and one of our subscribers wrote in with a request. “Teach us an easy way to filter out those companies that fit the fundamental and technical criteria you suggested.”

And he said he tried it out on Tradesmith and they have an elaborate system and couldn’t figure it out. So what would you say to that?

Jeff: Well, we’ve got half of it solved. The technical side of things, when I joined Tradesmith, Keith Kaplan, who’s the CEO, he said to me, we can make your life so much easier. And I laughed because, you know, I love the idea of people thinking they can make my life easier, but a lot of times people say that and they don’t really come through.

But Keith, of course, came through. They put together a screener for me. Basically, what it was is they, they interviewed me and said, OK, what is it that you’re looking for? Show us on this chart, what do you look for when you are selecting stocks to purchase or to sell uncovered.

My, typical Saturday routine is I get up super early in the morning before my entire family’s up and I pour a giant pot of coffee.

And I spent hour after hour after hour just going through chart after chart after chart, looking for the type of bottoming setups that I like to sell uncovered puts on. And it’s laborious.

It takes a lot of time, a lot of effort, and whatever, but it’s always been worth it, which is why I enjoy doing it. , basically, what Keith Kaplan and his team at Tradesmith did is they put together a stock screener that takes the parameters that I look for and does uses computers to generate a screen that spits out exactly the charts that I’m looking for without me having to go one by one by one by one by one.

And so every day gets emailed to me, I get a list of, I don’t know, maybe 150 to 200 stocks that fit the criteria that I’m looking for. And then I can go through those, and then pick my favorites out of that. The fundamental side of things, though, you got to do a little bit of homework. So, what I do is I take that screener, then I look for the socks that I think are fundamentally cheap. And I do my homework on it and try to figure out if it makes sense to, to sell uncovered puts on.

There’s no way to make an easy screener for that, because to determine whether or not a stock is fundamentally cheap, you have to dig into the, the balance sheets and the income statement and the annual reports and the earning statements and those sorts of things. So there’s no easy way around that. I guess maybe you could put together a screener that says, hey, I’m looking for these words, these parameters, etc. but that’s beyond the scope of what we’re doing right now. For right now, though, just being able to get the technical set up on a screener, is very valuable.

And even though I might still get 150 or 200 stocks, there’s usually a, a pretty good layer of cream at the top of those lists. So I have stocks that, that fit my parameters for selling uncovered puts, and I have stocks that fit my parameters for shorting if I’m interested in buying puts or don’t do this, sell uncovered calls. I’ll do some sort of strategy personally on something like that for a lot of folks, not an appropriate strategy. But, yeah, that work will eventually be done in that. For that subscriber.

Rachel: Fabulous. Well, I think that’s really all that you’ve got for today.

Jeff: So hopefully we’ll make this a regular thing and it’s just a matter of, you know, whenever we get together, I’ll share with you my thoughts on the market, where I think things are headed, where I think opportunities exist, and then we’ll answer some subscriber questions on top to make this a regular thing.

Rachel: And remember, if you enjoyed our talk, or if you have any questions that you want Jeff to answer in the future, send them to us at feedback@jeffclarktrader.com, and we’ll do another one of these installments.

  •  
❌