Issue#151, Volume#3

There’s Big Money In Boats Right Now – But Careful, It Won’t Last
It’s like trying to drive a car at night without any lights…
Many years ago, one of my mentors was explaining the real purpose of prices. Prices convey information across a complex economy. But when the money is “broken” – when it’s constantly inflated by the Federal Reserve – that information in those price signals is corrupted. The feedback mechanism breaks down. As a result, it’s like trying to drive a car at night without any lights – accidents are bound to happen.
We’re about to see an enormous accident in global tankers. But you’d never know it…
The shipping tanker market is gushing more cash than I’ve ever seen before. By the time the 3Q dividends land, the six largest tanker companies will have paid out over $3 billion in cash to shareholders this year. The indicated annual yields on some of these stocks is over 30%.
Should you grab some of this historical cash windfall…? Maybe – but only if you know when the music is going to stop.
How To Bet On The Boats
Tankers are the most cyclical, mega-capital industry in the world. Tankers’ depreciation schedules make data centers look like a safe long-term investment! A supertanker costs well over $100 million, takes two to three years to build, starts rusting the day it launches, and always dies young – it’s typically scrapped after two decades.
Why would anyone want to be in this business? Because the world cannot function without these ships. Roughly a third of the oil consumed on Earth reaches its refinery by ship.
The cost of the shipping is a tiny fraction of the value of the cargo. So when shipping gets disrupted or when demand for imported oil grows suddenly, there will be enormous increases to shipping rates because demand doesn’t change. A refinery that cannot get crude stocks has to shut down. Shut-in costs more than any freight bill, so refiners bid against each other for the last available vessel. The daily rate to hire very large crude carriers (“VLCC”) does not rise 20% or 40% in a tight market. It increases 500% or 1,000% – usually within days.
Prices can remain elevated for years because it takes a lot of time to build more ships and because ships are rusting out of the fleet all the time. The gap between when a shortage emerges and the delivery of a new fleet is “the window” – it comes along once every decade or so. And truly immense amounts of money can be made. But you must know when it’s time to leave the party.
I’ve written previously that the current market cycle reminds me of the 1973-1974 bear market. Energy prices spiked because of a war in the Middle East. U.S. politics were coming unraveled because of Watergate. And stocks were coming off huge highs in 1972, as the Nifty-Fifty – a group of high-quality stocks – were trading at higher multiples than anyone had ever seen before.
That market also featured a huge tanker cycle – almost exactly like the one we see today.
Leasing rates on the largest tankers quadrupled between May and September of 1973. Egypt and Syria attacked Israel on October 6 of that year. The Arab oil producers cut supply and embargoed shipments to the United States. The rush to find crude anywhere in the world and to ship it to America was on. The freight market went vertical.
Then it broke.
On October 24, spot rates for large tankers fell 75% in only three days. By November they were down 90%. Why did rates collapse so fast and so completely? The embargo cut the volume of oil so completely that there was nothing left to carry.
But the oil supply crash wasn’t the real disaster. The disaster was what happened next.
By January 1, 1974, the world’s shipyards had orders for 193 million tons of new tanker capacity – 90% of the entire existing fleet. In other words, the fleet owners ordered themselves an entire second fleet. The new ships came. And kept coming. World tanker capacity – the supply – went from 440 million tons in 1973 to 494 million in 1974, 544 million in 1975, and 633 million by 1978, while the demand didn’t grow at all.
By Q2 1976, almost 20% of the entire world tanker fleet was moored and out of service. But idling a ship is not free: keeping a supertanker anchored costs as much as $75,000 a month. Plus, it costs roughly $700,000 to prepare it and secure a berth.
By February 1979, the rate index for the largest tankers had fallen to a level roughly 95% below the 1973 peak. In April 1983, a full 10 years after the peak, the world had 310 million tons of tanker capacity available but it still only needed 137 million. There was a surplus of 173 million tons, meaning more idle oil-carrying capacity than the entire industry could employ!
It Happened Again In 2008
I wasn’t in the markets during the 1970s, but I watched the same cycle happen again in the mid-2000s.
As China’s economy boomed following its entry into the World Trade Organization (“WTO”), demand for crude carriers surged amidst a broad commodities mania. Oil surged from $30 to $147.50 a barrel by July 11, 2008. Demand for tankers followed crude higher. Rates for the largest tankers averaged $53,000 a day in January of 2008 and peaked above $169,000 a day by July.
What happened next? Global tanker building contracts, which had been running $30 billion a year, jumped to $91 billion in 2004, $104 billion in 2005, and $135 billion in 2006. The price of a new supertanker went from $63.5 million in 2002 to $129 million by the end of 2006. But owners kept ordering. By January 2007, Clarkson’s (the world’s largest shipbroker) put the global orderbook at 300 million tons – roughly 31% of the existing fleet.
The bust took five years to work through. And not everyone survived. Overseas Shipholding Group, then the largest American tanker operator, filed for bankruptcy in November 2012 with $4.15 billion of assets against $2.67 billion of debt.
Today, we’re sitting in “the window” – supplies for tankers are super tight. Leasing rates have soared. And a whole new fleet is on order. The clock is ticking… but how long will “the window” stay open?
With the war in Iran this spring, the Strait of Hormuz was effectively closed. That left a huge number of tankers stranded in the Persian Gulf. Rates for the largest tankers touched $436,000 a day. Traffic has been resuming gradually, though ships are still sitting idle around the strait waiting to move. Every ship stuck at anchor is a ship not competing for cargo. Veson Nautical (whose software handles booking and payment for the fleet) does not expect full normalization before the end of this year.
The other factor pushing leasing rates higher isn’t transitory. Oil production keeps rising in the United States, Guyana, Brazil, and Argentina while consumption growth is highest in Asia. A barrel shipped from Guyana to China occupies a vessel far longer than a barrel shipped from the Persian Gulf to Japan. The industry counts demand in ton-miles. The longer the voyage, the higher the transportation cost, and the more demand for ships grows.
Finally, there is the age of the fleet. Nearly half the world’s tanker capacity is more than 15 years old. Roughly 130 supertankers aged 20 or more are still trading today against fewer than 20 of them five years ago. Old ships sail slower, sit longer in port, and carry less.
But… the new ships are coming. Through the end of July, fleet owners contracted 96.4 million tons of new tankers, against a previous annual record of 81.3 million tons set in 2006. This year’s new ship contracting will surpass 100 million tons. So far, shipping companies have ordered 197 supertankers and 103 Suezmaxes (the largest ships that can transit the Suez Canal), records in both classes.
But they aren’t on the market – yet. In a “normal” year, something around 40 supertankers are delivered. But only one supertanker was delivered in 2024. And only five in 2025. Owners only scrapped 2.16 million tons in 2026. The order book delivers in 2027 and 2028.
Until the new boats come online, there’s a lot of money to be made in shipping.
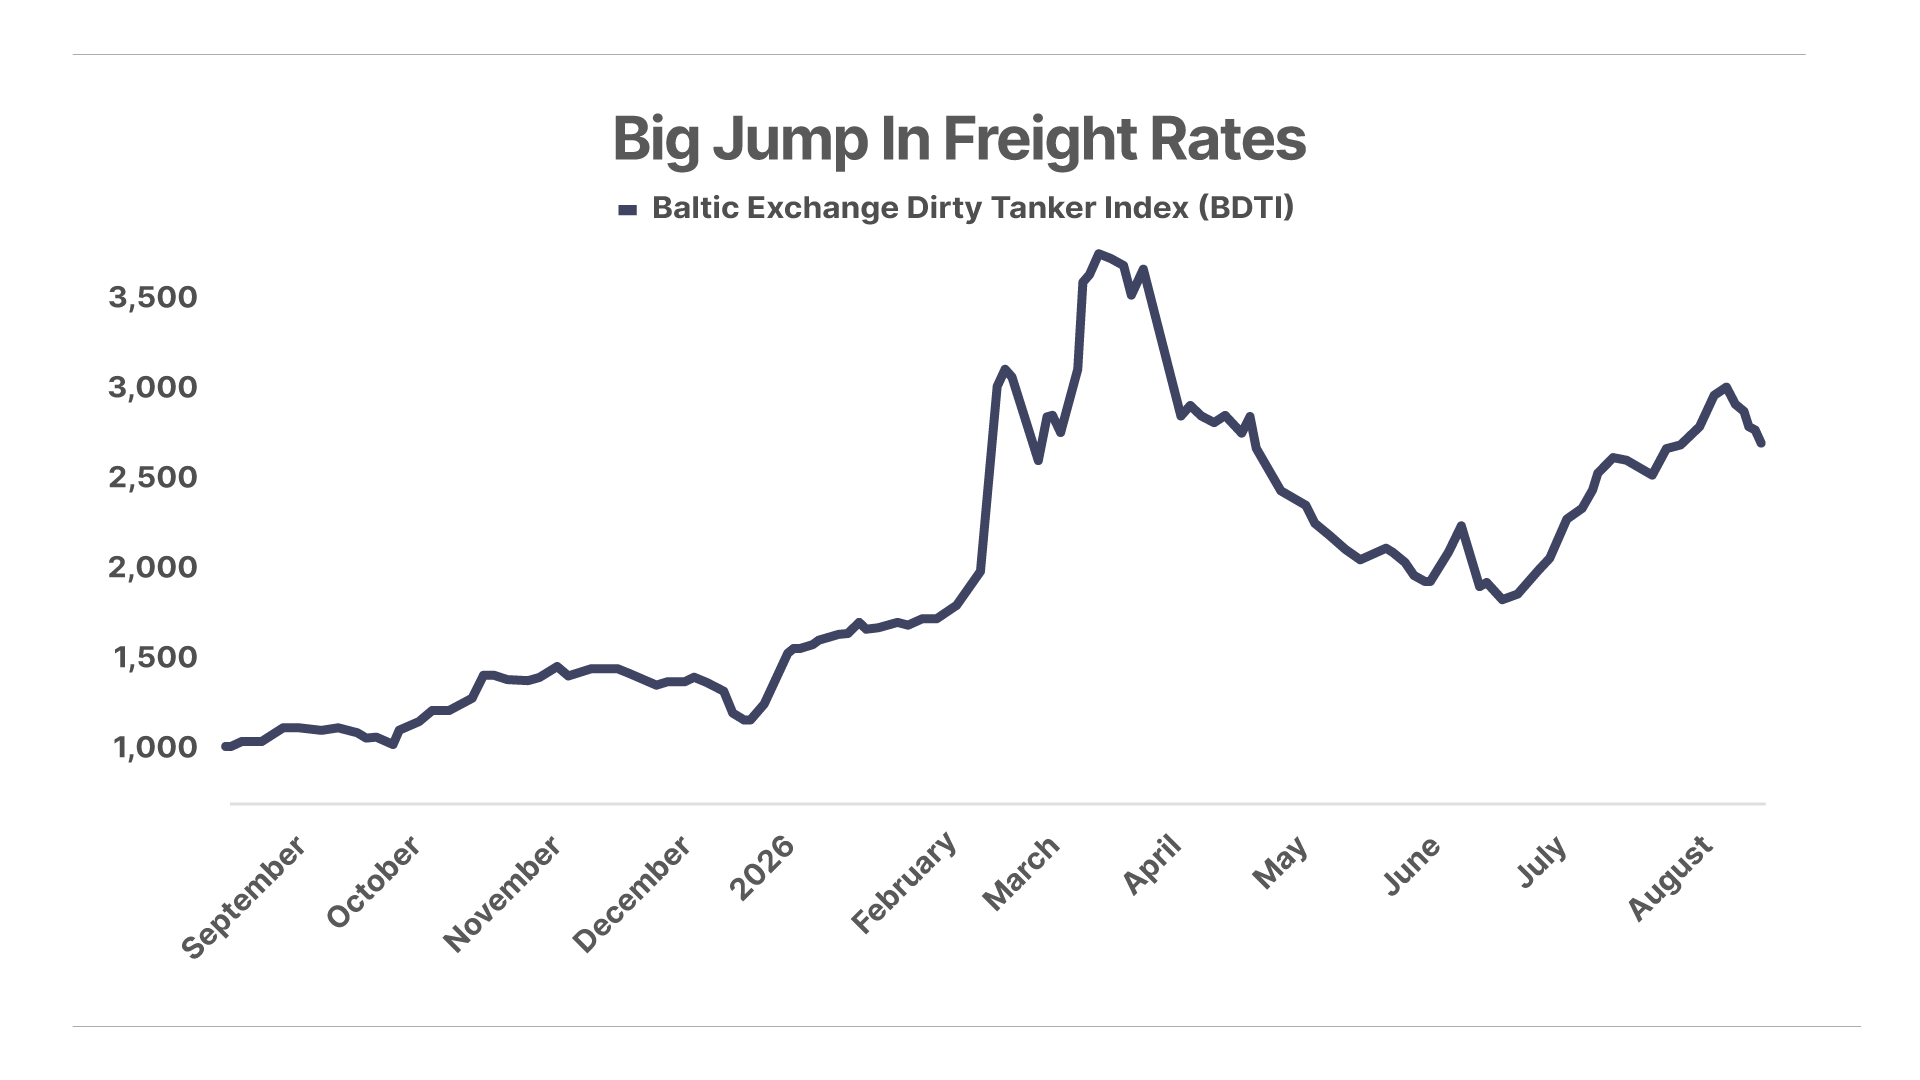
Frontline (FRO) earned $659.2 million in Q2, $2.96 a share, on revenue of $943.3 million. Its supertankers earned $152,700 a day against the $23,800 a day Frontline needs to cover cash costs. It declared a $2.61 a share dividend, which is 100% of adjusted profit, and an annualized yield of 23.6%.
International Seaways (INSW) earned $294.9 million in adjusted profit, $5.91 a share, and generated $261 million of free cash flow, a company record by roughly $100 million. Its fleet averaged $79,000 a day against $27,500 a year earlier, its supertankers cleared $150,000. The board declared $5.05 a share on August 7. That’s 20.2% annualized.
DHT Holdings (DHT) earned $198.3 million, $1.23 a share, with its spot vessels earning $162,600 a day against cash costs of $22,600. DHT made more money in the first half of 2026, $362.9 million, than in any full year in its history. It declared a quarterly of $1.22, which is 100% of ordinary profit and annualizes to 24.8%.
Okeanis Eco Tankers (ECO) earned $230.3 million against $26.9 million a year earlier. It paid $5.25 a share on August 21, which annualizes to 30.9%.
So… the question is… how long will “the window” remain open?
We can see the next two quarters clearly, because the ships are already booked.
- Frontline has 86% of its Q3 supertanker days fixed at $156,900 a day, above the $152,700 it just earned, and 79% of Suezmax days at $117,400 against $111,500
- DHT has 1,020 days chartered out at $75,900 and 58% of its spot days booked at $152,700
- International Seaways has 48% of its days at $61,000 blended across crude and refined product against cash costs running between $14,500 and $25,700, those bookings pay the dividends through the end of the year
How much longer can it run after that…? Maybe another one or two quarters, with risk growing substantially after June of next year.
What will the crash look like?
The tanker orderbook today stands just over 31% of the fleet, where in January 1974 it stood above 90%. Owners cannot flood this market the way their grandfathers did. And the fleet is old. There are a lot of boats that need to be replaced.
But investors should remember: After the last boom in 2008, Frontline’s dividend went from $3.00 to $0.02 in 11 quarters.
Tell me what you think of today’s Daily Journal: porterstansberrydirect@gmail.com
Good investing,
Porter Stansberry
Stevenson, Maryland
Presented By: TradeSmith
What Happens on the 9th Trading Day?
Coming up on the 9th trading day of this month, you buy five specific blue-chip stocks. Then you could potentially watch your money grow like clockwork — all without using leverage or options. Click here to see why just five stocks, and why this one day each month is the only day that really matters.
Editor’s Note: Keep in mind, we only accept advertising from publishers we know to offer well-researched ideas vetted by a legal team, excellent customer service, and reasonable refund policies. TradeSmith is one such partner. We do not, however, under any circumstances make any representations about their investment ideas or strategies, nor will we warrant them as equal to our own. We do recognize that the markets are tempestuous and, at times, ideas that we may not endorse prove valuable.
3 Things To Know Before We Go…
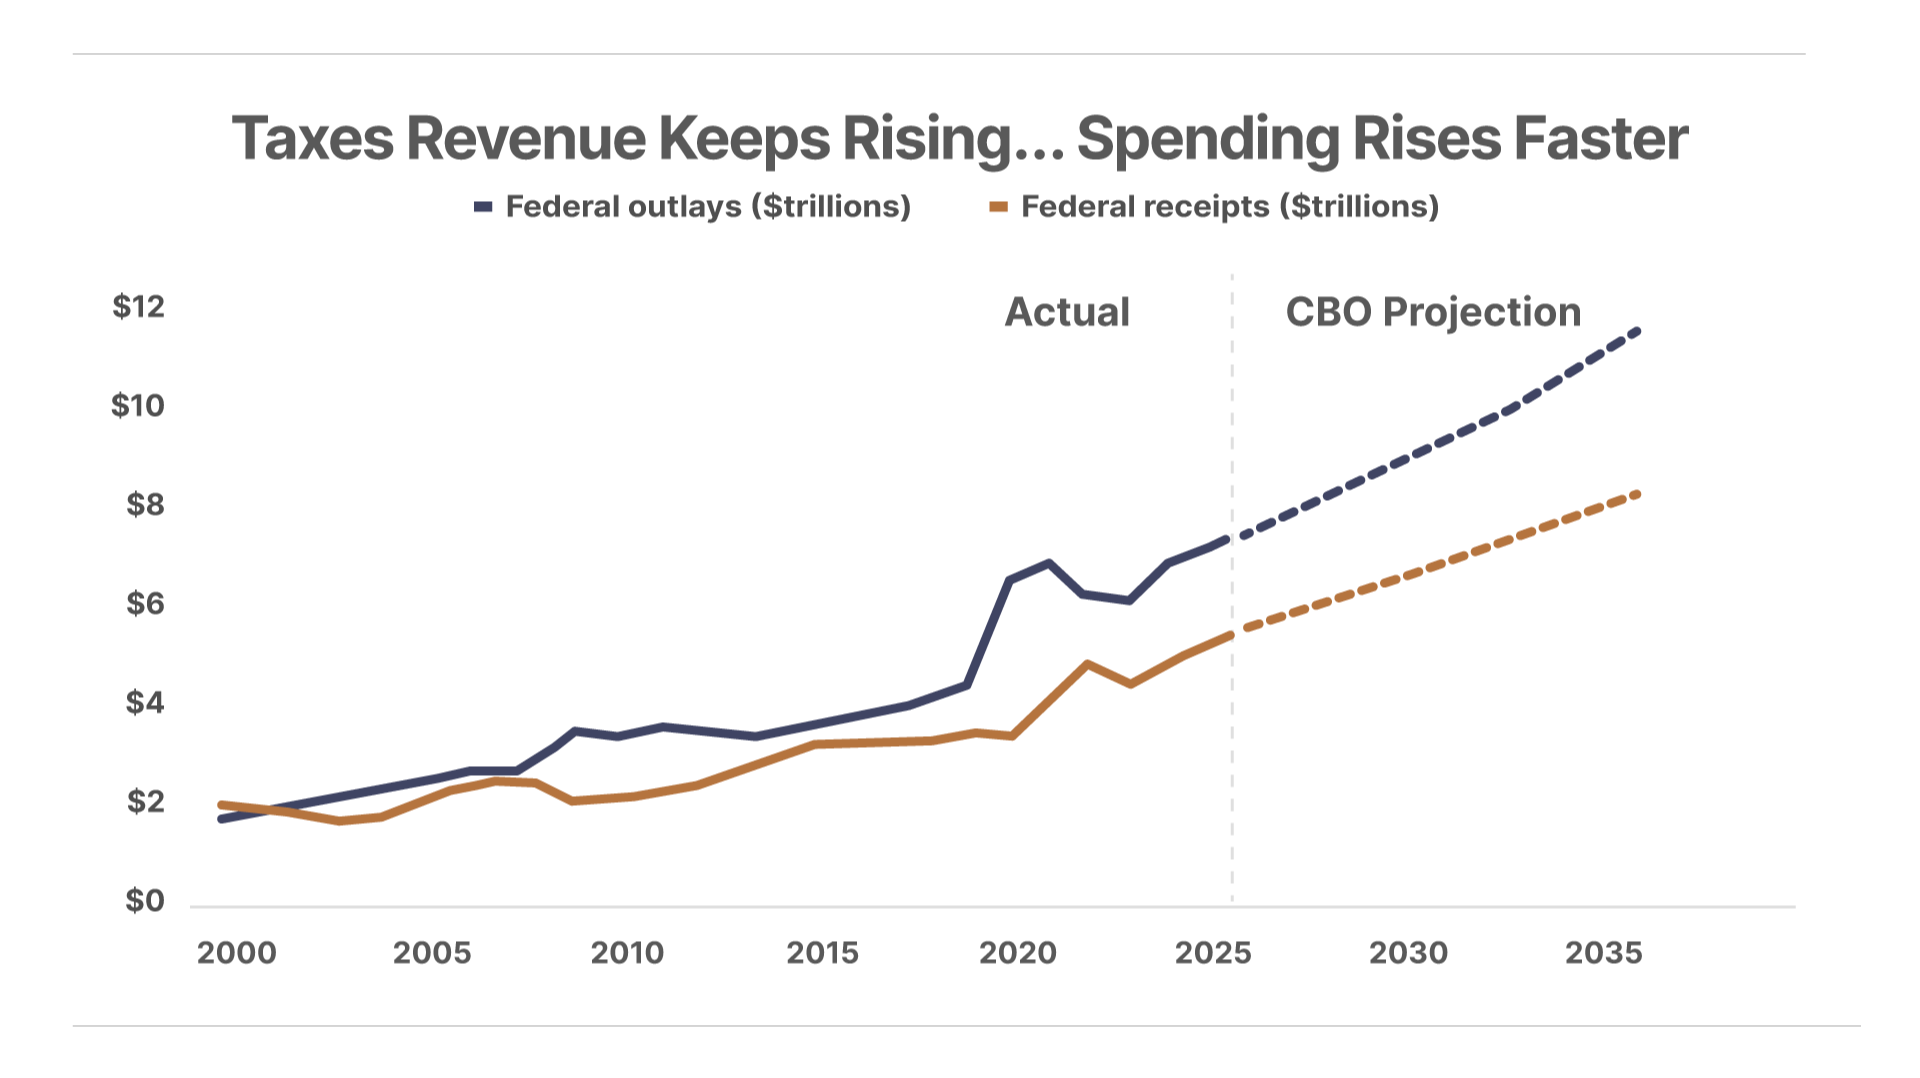
1. Federal tax revenue keeps rising, but spending is rising faster. The U.S. Treasury collected a record $5.23 trillion in fiscal 2025, up 6.4% from the prior year. Yet it spent $7.01 trillion, leaving a $1.78 trillion deficit. Through the first 10 months of fiscal 2026, revenue is up $139 billion, or 3%, while outlays are up $309 billion, or 5%. Taxes aren’t the problem… spending is.
2. Money supply keeps climbing. Global money supply reached a new high of $150 trillion in June, up $10.7 trillion (8%) over the past year. Since the COVID-19 outbreak in 2020, global money supply has expanded by $50 trillion, driving consumer prices and interest rates higher with it. With no end in sight to the monetary expansion from global central banks, inflation and interest rates will likely remain stuck in a “higher for longer” regime for the foreseeable future.
3. Big Tech is now more capital-intensive than mining. Alphabet’s (GOOG) capital spending reached $44.9 billion last quarter versus $39.1 billion of cash generated by operations – 115% – producing its first negative free cash flow since its 2004 IPO. Meta (META) spent 98% of its operating cash. Amazon (AMZN) also spent more than it generated in cash over the past year. Meanwhile, the largest gold and silver miners spend less than 50% of operating cash on capex. The AI buildout has turned the most capital efficient businesses in history into mining companies with worse assets. At least a gold deposit produces for decades. A rack of AI chips is written off in five years.
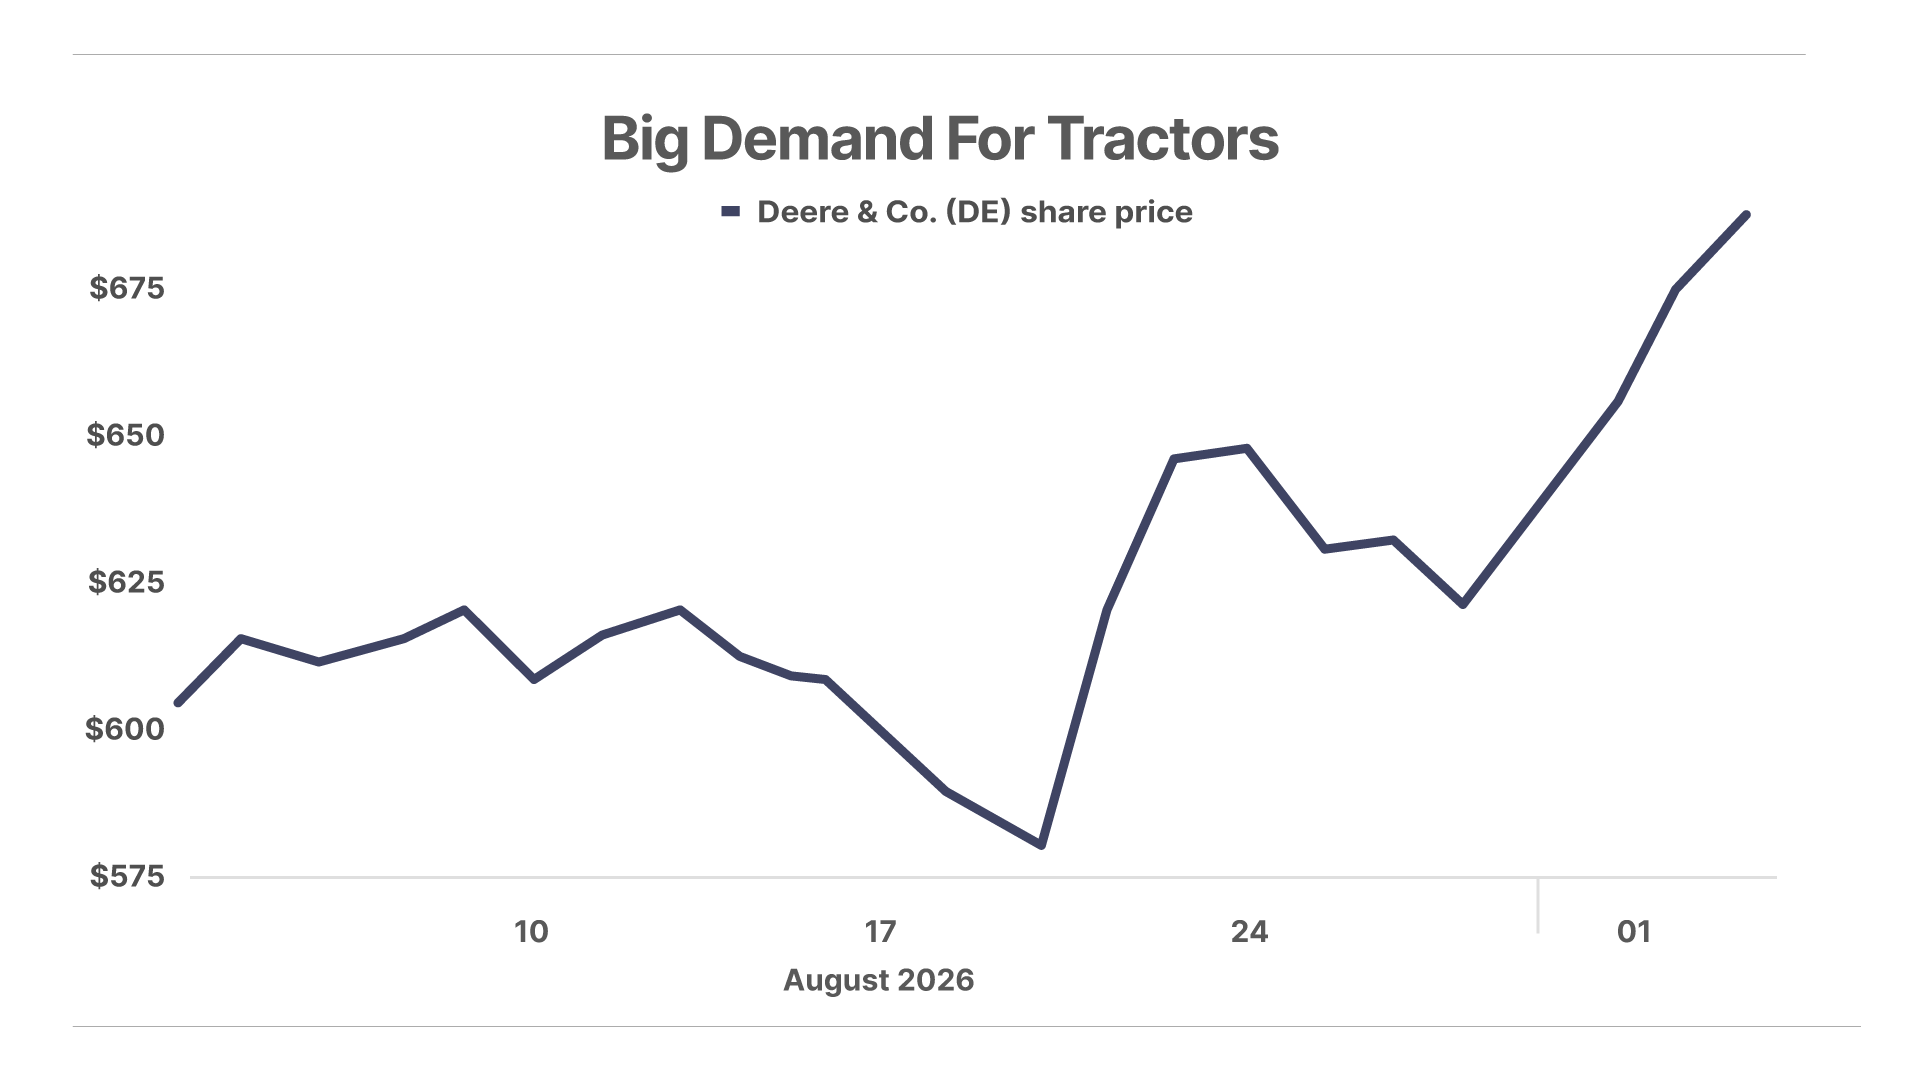
Chart Of The Day… Deere & Co. (DE)
Strong demand for its agricultural and manufacturing equipment has sent shares of Deere & Co. considerably higher over the last month – up 18% in August and 71% since we recommended them to Complete Investor subscribers.
Yesterday, Tuttle Capital CEO Matt Tuttle explained to Journal readers the logic behind the Porter & Company Porter Portfolio Index ETF (PCPP), based on Porter’s Permanent Portfolio.
“Don’t Play FOMO”
Linda T. writes:
I totally agree with Porter and Tuttle. Playing FOMO does not work for investors with a longer-term view. CNBC’s Jim Cramer is just a “quacker” quack, quack, for audience clicks. Thanks for the good information.
“How Long Can It Be Maintained?”
Tony G. writes:
I think PCPP is an awesome concept and hope that it gets the traction it deserves. The risk is identified within the article itself though – being early, and even right, is not necessarily a recipe for success. The anti-Cramer fund shut down after a year…How long is something maintained if it’s not making money?
Best wishes for all your endeavours!
Porter & Co. Market Snapshot
|
Price |
Yesterday’s Return |
Year-to-Date Return |
| S&P 500 Index |
$7,631.47 |
-0.71% |
12.3% |
| Gold per ounce |
$4,328.82 |
-2.41% |
0.3% |
| Bitcoin |
$77,414 |
-1.83% |
-12.4% |
| Oil (West Texas Intermediate) per barrel |
$90.22 |
4.53% |
55.7% |
| Berkshire Hathaway (BRK) |
$752,091 |
-0.60% |
-0.4% |
| Porter’s Permanent Portfolio |
– |
-0.73% |
3.2% |
| The Better Than Berkshire Index |
– |
-0.76% |
7.7% |
|
Total Return |
Annual Return |
| Porter & Co’s Top Ranked* |
35.3% |
16.2% |
|
Yield |
Yesterday’s Change |
Change
Year-to-Date |
| U.S Treasury 30-Year Yield |
5.27% |
3 bps |
43 bps |
| Prices as of 4:00 pm ET September 1, 2026 | bps = basis points (or 0.01%) |
| *A Complete Investor risk rating of 1 is defined as a “low risk, high allocation” security, while positions rated closer to a 5 are higher risk. Porter & Co.’s top-ranked positions include those rated either 1 or 2 in Complete Investor portfolio. |
Porter & Co. Top Positions
| Publication |
Ticker |
Description |
Total Return |
| Biotechnology |
QURE |
uniQure |
237% |
| Biotechnology |
SGMT |
Sagimet Biosciences |
195% |
| Complete Investor |
BTC/USD |
Bitcoin |
187% |
| Complete Investor |
BWXT |
BWX Technologies |
185% |
| Biotechnology |
NUVB |
Nuvation Bio |
161% |
| Biotechnology |
TGTX |
TG Therapeutics |
158% |
| Biotechnology |
ROIV |
Roivant Sciences |
153% |
| Complete Investor |
PM |
Philip Morris |
133% |
| Complete Investor |
SKWD |
Skyward Specialty Insurance |
133% |
| Biotechnology |
QURE |
uniQure |
131% |
| Prices as of 4:00 pm ET September 1, 2026 |
Please note: The investments in our “Porter & Co. Top Positions” should not be considered current recommendations. These positions are the best performers across our publications – and the securities listed may (or may not) be above the current buy-up-to price. To learn more, visit the current recommendations page of the relevant service, here| New Window. To gain access or to learn more about our current recommendations, call our Customer Care team at 888-610-8895 or internationally at +1 443-815-4447.
The post How’s A 30% Annual Dividend Sound? appeared first on Porter & Co..

 Login